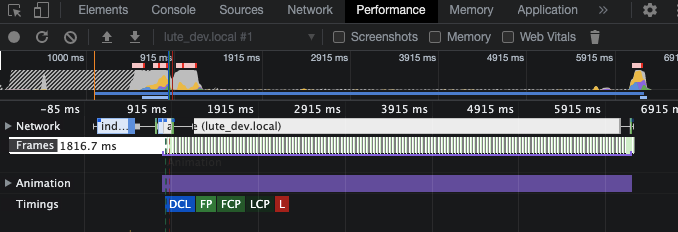
DataTables load on Chrome has several seconds of Idle time
DataTables load on Chrome has several seconds of Idle time
Hello all, I have a server-side datatables call which works great, but there is a lot of Idle time in Chrome. I've tried various settings, and nothing cuts the time down. Even if only a single row is output, there are many seconds of delay.
Here's the full setup function. There are a couple of js calls in the renders, but they are all single-line function calls, and commenting them out does nothing to the render time:
  let setup_text_datatable = function(initial_search) {
    var table = $('#texttable').DataTable({
      responsive: true,
      select: true,
      lengthMenu: [ 1, 25, 50 ],
      paging: true,
      info: true,
      searching: true,
      processing: true,
      serverSide: true,
      deferRender: true,
      scrollX: false,
      scrollY: '50vh',
      search: { search: initial_search },
      columnDefs: [
        {
          "name": "TxTitle", "targets": 0,
          "render": function ( data, type, row, meta ) {
            return `<a href="/read/${row[5]}">${row[0]}</a>`;
          }
        },
        { "name": "LgName", "targets": 1 },
        { "name": "TagList", "targets": 2 },
        { "name": "WordCount", "targets": 3 },
        {
          "name": "TermStats",
          "targets": 4,
          "searchable": false,
          "orderable": false,
          "render": function ( data, type, row, meta ) {
            // columns are defined below.
            let mkspan = (col, style) => row[col] == null ? '' : `<span class="${style}">${row[col]}</span>`;
            const arr = [
              mkspan(7, 'status0'),
              mkspan(8, 'status1'),
              mkspan(9, 'status3'),
              mkspan(10, 'status5')
            ];
            return arr.join(' ');
          }
        },
        {
          "targets": 5,
          "data": null,
          "searchable": false,
          "orderable": false,
          "render": function ( data, type, row, meta ) {
            // TODO:security - add CSRF token
            let ret = '';
            const txid = row[5];
            if (row[6] == 0) {
              // not archived
              ret += `<img src="/icn/inbox-download.png" title="Archive" onclick="confirm_archive(${txid})" />`;
            }
            else {
              ret += `<img src="/icn/inbox-upload.png" title="Unarchive" onclick="confirm_unarchive(${txid})" />`;
            }
            ret += `<img src="/icn/minus-button.png" title="Delete" onclick="confirm_delete(${txid})" />`;
            return ret;
          }
        },

        /* Extra data that is returned in the row for rendering, but not shown. */
        { "name": "TxID", "targets": 6, "data": null, "visible": false },
        { "name": "TxArchived", "targets": 7, "data": null, "visible": false },
        { "name": "Unknown", "targets": 8, "data": null, "visible": false },
        { "name": "Learn1_2", "targets": 9, "data": null, "visible": false },
        { "name": "Learn3_4", "targets": 10, "data": null, "visible": false },
        { "name": "Learn5", "targets": 11, "data": null, "visible": false }
      ],

      // Ajax call
      ajax: {
        url: '/text/datatables/{{ status | lower }}',
        type: "POST",
        dataType: "json"
      },

    });
Below is the performance as recorded by Chrome. You can see there's about 5 seconds of idle time:

The underlying SQL query takes just a few hundred ms, and returns very quickly. The ajax call returns the json in 20 ms.
Everything is running locally, no network issues etc, it's all idle time in Chrome.
I've searched this forum and elsewhere and can't see what the problem might be. Any suggestions?
Thank you! Jeff
Answers
Going to close this, it might be a different issue!
I'm unable to close this issue, hopefully someone else can close it for me. Cheers! jz
Sounds like there is a delay in the server-side script responding with data. I'd suggest checking the network tab for timing information on how long the Ajax request is taking.
Regards,
Allan