How do customize excel with using datatable in jQuery?
How do customize excel with using datatable in jQuery?
I m using DataTable (Jquery) to export excel file. But I facing on how do put extra information to export excel file. I have tried some code but it didn't meet my expectation.
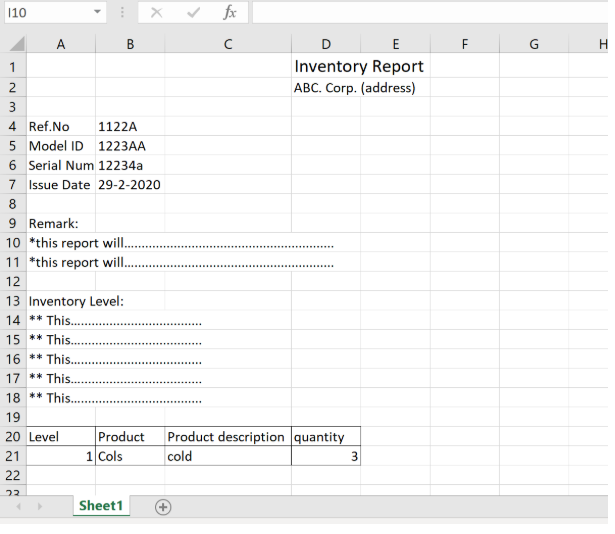
My expected exported excel file is as below picture:

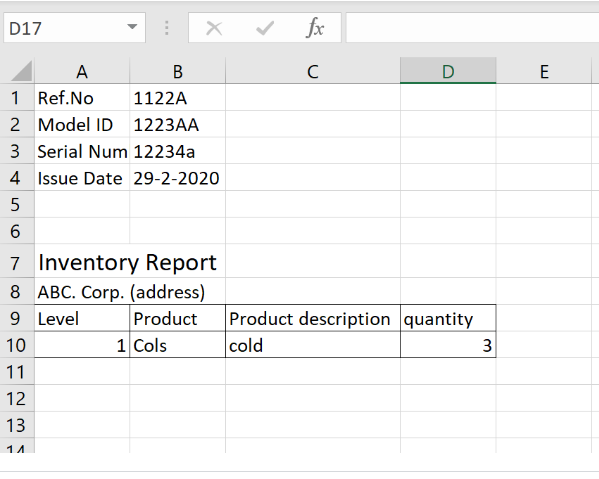
However my output is as below picture, my title report and address is located at middle isn't on top of report:

enter image description here
with using code below:
{
extend: 'excelHtml5',
title: 'Trace Report',
messageTop: 'ABC company' + 'address',
//message: "Any message for header inside the file. I am not able to put message in next row in excel file but you can use \n"+'modelID'+modelId,
render: function (data, type, full, meta) {
return '<a href="' + data + '">Download</a>'; //change the button text here
},
customize: function (xlsx) {
    var sheet = xlsx.xl.worksheets['sheet1.xml'];
    var numrows = 10;

    // add styles for the column header, these row will be moved down
    var clRow = $('row', sheet);

    //$(clRow[0]).find('c').attr('s', 32);

    //update Row
    clRow.each(function () {
        var attr = $(this).attr('r');

        var ind = parseInt(attr);
        ind = ind + numrows;
        //ind is num of row +1
        $(this).attr("r", ind);
    });

    // Create row before data
    $('row c ', sheet).each(function (index) {
        var attr = $(this).attr('r');

        var pre = attr.substring(0, 1);
        //pre=A,B,C..-F repeat 5 time
        var ind = parseInt(attr.substring(1, attr.length));
        ind = ind + numrows;
        $(this).attr("r", pre + ind);
    });

    function addRow(index, data) {
        var row = sheet.createElement('row');

        row.setAttribute("r", index);
        for (i = 0; i < data.length; i++) {
            var key = data[i].k;
            var value = data[i].v;

            var c = sheet.createElement('c');
            c.setAttribute("t", "inlineStr");
            c.setAttribute("s", "2"); /*set specific cell style here*/
            c.setAttribute("r", key + index);

            var is = sheet.createElement('is');
            var t = sheet.createElement('t');
            var text = sheet.createTextNode(value)


            t.appendChild(text);
            is.appendChild(t);
            c.appendChild(is);

            row.appendChild(c);

            debugger;
        }

        return row;
    }

    //add data to extra rows
    var countryStateList = 'asd';
    var agencyValue = 'asd';
    var reportGroupList = 'asd';
    var certNo = '3e'

    var r1 = addRow(1, [{
        k: 'A',
        v: 'Certificate Number'
    }, {
        k: 'B',
        v: 'Model ID:'
    }, {
        k: 'C',
        v: 'Serial Number'
    }, {
        k: 'D',
        v: 'Calibration Date'
    }]);
    var r2 = addRow(2, [{
        k: 'A',
        v: countryStateList
    }, {
        k: 'B',
        v: agencyValue
    }, {
        k: 'C',
        v: reportGroupList
    }, {
        k: 'D',
        v: certNo
    }]); //add one cell for row 1
    //$('row c[r^="A"]', sheet).attr( 's', '25' );
    var sheetData = sheet.getElementsByTagName('sheetData')[0];
    // sheetData.insertBefore(r4,sheetData.childNodes[0]);
    // sheetData.insertBefore(r3,sheetData.childNodes[0]);
    sheetData.insertBefore(r2, sheetData.childNodes[0]);

    sheetData.insertBefore(r1, sheetData.childNodes[0]);
}
}
Answers
We're happy to take a look, but as per the forum rules, please link to a test case - a test case that replicates the issue will ensure you'll get a quick and accurate response. Information on how to create a test case (if you aren't able to link to the page you are working on) is available here.
Cheers,
Colin
This is my test cases, thank for answering.
https://codepen.io/jovis9611/pen/zYGvgOW
The problem appears to be your code that adds the additional lines. If you remove your
customizecode, then the header appears as expected - I think your code to add the lines is over-writing that. You're also using old versions of the library, so it would be worth changing the libraries to be:Colin