How to show in one row grouped data with aggreagates in Datatables ?
How to show in one row grouped data with aggreagates in Datatables ?
 JohnWIck95
Posts: 55Questions: 2Answers: 0
JohnWIck95
Posts: 55Questions: 2Answers: 0
Hi,
I want to group some similar data in to a row with aggregate.
I tried with the plug-in RowGroup but it only shows by level (level 0, level 1 ... level n).
I am trying to create a table with DataTables. I want to have in my Datatable table :
A row group with the different data of the table and with other columns aggreates
* All grouped data in one row
* Child rows with details of the grouped rows
| Name | Position | Office | Age | Start date | Salary |
|---|---|---|---|---|---|
| Tiger Nixon | System Architect | Edinburgh | 61 | 2011/04/25 | $320,800 |
| Garrett Winters | Accountant | Tokyo | 63 | 2011/07/25 | $170,750 |
| Tiger Nixon | System Architect | Edinburgh | 61 | 2009/01/12 | $86,000 |
In this example, we can see two rows with the same data. And i want to group the data with some specific columns like the Name, Position, Office and Age. It's like a GROUP BY in SQL and i need to show the first row with the grouped data and some agreggrates on the two last columns. I've tried with Datatable RowGroup but it only shows data by level (level 0, level 1, level 2, etc.)
Thank you in advance
This question has accepted answers - jump to:
Answers
EDIT: I think this thread is asking a similar question. It uses
rowGroup.dataSrcas a function to combine the data (columns) used for the grouping. Is this what you are looking for?Kevin
Yes @kthorngren thanks for the thread. I have passed so many times in the forum and couldn't find an anwser.
With the thread i have noticed that we can show the data of the column (by doing a return with row.dataname) and group them into the dataSrc of rowGroup.
Does anyone know how can I make it as a collapsible, please ?
I want to have the child row action on these.
And also how can put an aggregate value in the row. I've tried with startRender but it isn't working.
Checkout this thread.
Kevin
Thanks Kevin but i don't know how to make it work with my dataSrc which is llike this :
rowGroup: {
dataSrc: function(row) {
return row.last_name + ', ' + row.first_name;
}
}
And I don't know how to use the startRender with this dataSrc.
Thanks in advance
John
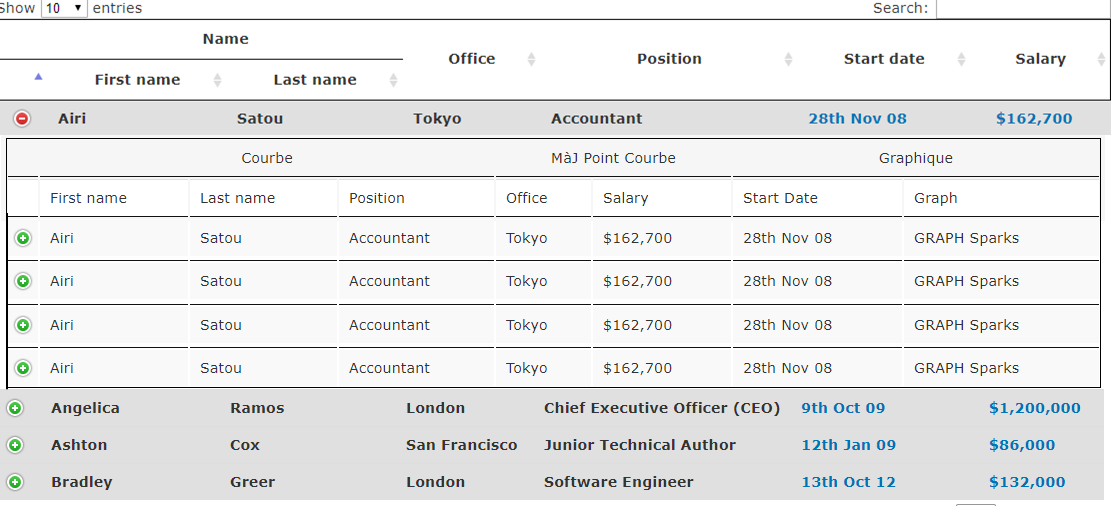
What i want to have
{ '+' parent 100 row) {groupedCol 1}, {groupedCol 2}, {groupedCol 3}, AVG value of {groupedCol4}
When we click in the '+' the child data appears like this
{ '+' parent 110 row} {detailGroupedCol 1}, {detailGroupedCol 2}, {detailGroupedCol 3}, AVG value of {detailGroupedCol 4}
I adapted the last example in that thread to the dataSrc as a function example:
http://live.datatables.net/jedelezu/24/edit
Kevin
Thank you for your help @kthorngren It works !
But i have a little problem of having the '-' icon when the parent row shows his children and also to create an avg.
I've tried to do that :
var Avg = rows
.data()
.pluck(6)
.reduce( function (a, b) {
return a + b*1;
}, 0) / rows.count();
Thanks in advance for your help
Not sure what you are asking for. Are you asking for something like this example?
https://datatables.net/examples/api/row_details.html
You have
.pluck(6). The6is for the 7th column if you have array based data. If you have object based data, ie usingcolumns.data, you need to use the key for that column. I would suggest start with debugging the statement to see what is happening. If you still need help then please provide a link to your page or update the test case to show the issue you are having.Kevin
Yes I want the change of icon like in the example with the row details.
But I need absolutely to have aggregates on the last colum of the rowGroup.
And i don't understand why the avg returns a 'NaN'. I've selected the correct column in the pluck.
Here's the code of the row group :
rowGroup: {
dataSrc: function(row) {
return '</tr><td rowspan="1" colspan="1" style="width: 50px;" class="dtrg-start" colspan="3"></td><td rowspan="1" colspan="1">' + row.RATE_CURVE_ID + '</td><td rowspan="1" colspan="1">' + row.data1 + '</td><td rowspan="1" colspan="1">' + row.data2 + '</td><td colspan="1" rowspan="1">' + row.data3 + '</td><td colspan="1" rowspan="1">' + row.data4 + '</td>';
},
startRender: function ( rows, group ) {
var collapsed = !!collapsedGroups[group];
rows.nodes().each(function (r) {
r.style.display = collapsed ? '' : 'none';
});
Thank you in advance
Its really hard to say without seeing the problem with your data. What do your console logs output? Please update or create your own test case with an example of your data so we can help debug.
Are you using
columns.data? If use then as I stated above you will need to usepluck('data5')instead of the column index.Here you go:
http://live.datatables.net/jedelezu/26/edit
I added the the PNG images to the CSS tab. Added
.toggleClass('shown', !collapsed);to the return statement instartRenderand added an emptytdwith the classname ofdetails-control. The behavior should be the same as the child row details example.Kevin
It works now @kthorngren ! For the avg, the problems was in the
$.fn.dataTable.render.number(',', '.', 0, '$').display( dataAvg );
And I corrected with
dataAvg = $.fn.dataTable.render.number(',', '.', 3).display( dataAvg );
Thank you Kevin for taking the time to help me and giving some information to solve my Datatables problems
John
Do you know how we can hide a column but not the headers and then show a child table ?
As my row are grouped with rowGroup and i've the aggregates, I want to have the header table of the original table but to hide the rows of the original table then to show a child table as a child row.
I've done that but the header disappears :
columnDefs: [{
// Pour afficher les valeurs decimales avec trois chiffres apres la virgule
targets: [7],
render: $.fn.dataTable.render.number(',', '.', 3)
},
{
visible: false, targets: [0, 1, 2, 3, 4, 5, 6, 7]
}],
Thanks in advance
John
We're happy to take a look, but as per the forum rules, please link to a test case - a test case that replicates the issue will ensure you'll get a quick and accurate response. Information on how to create a test case (if you aren't able to link to the page you are working on) is available here.
Cheers,
Colin
Are you saying that you want the RowGroups to be collapsed to start with then only show when clicking the button?
If so just change the first line in StartRender, like this:
http://live.datatables.net/jedelezu/28/edit
If this is not what you are asking for then as Colin asked please update or provide a test case showing the issue so we can see what you are doing.
Kevin
Thanks for your messages @colin and @kthorngren.
I've created test case. Here's the link http://live.datatables.net/komubuce/85/edit
Show i've masked the cells and mask the values but i want them to disappears and to show the child table.
What i want is like this
1. Row Group (Parent) if '+' or row click then show 2.
2. Child table, close when '-' or row from 1. is clicked
I'm at your disposal if you need further information.
Thanks in adavance.
John
Not sure I understand what you are asking. But I did notice the child row doesn't close if you close the group. I added this to startRender to close the child rows:
http://live.datatables.net/komubuce/86/edit
Is this what you are asking for?
If not please provide more specifics of what you want to do.
Kevin
Thanks Kevin for this i was about to asking about this also, but you've done well by correcting that.
And for my previous request, here is a schema of what i want :
The rows displayed within the group are Datatables rows. Whereas the rows in the child detail rows are not and the display is controlled by you. Datatables expects a
thelement for each column to place sorting listeners, etc on. There is not a built-in way to do what you want. You can try applying CSS in thethto hide the headers you don't want displayed. You will need to test to make sure there are no negative impacts to your Datatable.Kevin
Thanks for the indications. I Have tried to add a css via
"createdRow": function ( row, data, index ) {
$('td', row).eq(3).css("display", "none");
},
But is there a way to all the rows (when i mean hide it's for display: none
Do know a way to hide all the rows on the init of the table.
or to hide the rows on the init and by clicking a button the rows are shown
Thanks in advance
John
Thanks for the indications.
I Have tried to hide the rows to add a css via
"createdRow": function ( row, data, index ) {
//$('td', row).eq(3).css("display", "none");
$('td', row).css("display", "none");
$('td', row).eq(0).css("display", "");
},
http://live.datatables.net/komubuce/88/edit
Here only the rows at the position 0 were shown because i new to show the second table.
But is there a way to hide all the rows (when i mean hide it's for display: none ) and have the child table instead of the rows of the parents table.
Here's what i have :
1. + RowGroup row
2. + (parent row to hide)
3. child table
And you can see below, what i want :
Do know a way to hide all the rows on the init of the table and to show the child table instead of showing the rows
Thanks in advance
John
And also does anyone know how to get all the child Row data in on array ?
Thanks in advance
John
Are you trying to hide certain column headers or column data?
Not sure what you mean. Please provide more details of what you are asking.
Kevin
I'm trying to hide only the principal rows (i don't want them) but i need the column header because they correspond to the data that were in the RowGroup.
Here you can see what i have actually http://live.datatables.net/komubuce/88/edit
And i want to make disapear the rows and have one child table with all the child table data per Row Group
Here's what i want :
Seems like a complex solution. What exactly are you trying to achieve?
Maybe we can come up with a different solution.
Kevin
Yes exactly as you said it's very complex. But i wanted to do that because I would like to do it in one single way because i recover all the data and that's mine i can show some groupe data
Do you know a way to show the child table on a popup or to get and show the child table when the rowGroup '+' was clicked ?
Thanks in advance.
John
Please provide more details of what you are trying to do.
Is the data part of the row data?
If it is just display the rows normally showing the columns you want to display.
If not where does it come from?
Kevin
Yes the data is part of the row data. The problem is that i want to group the data and also do some operations on the data which was grouped.
And my only problem is that I can't show the second table when I click on a row which was grouped. And also an other problem is that the child table doesn't add all the row in a single table.
I'm trying to do another way by doing to query then two Datatables.
Can we call two ajax services on Datatables ? I mean one for the normal row (the principal rows) and another for the child detailed table.
Thanks in advance
John
What operations do you want to do? I'm trying to understand what you would be doing differently by showing the row data in a "Child Row" that can't be accomplished by just showing the normal Datatable row.
This blog describes how to fetch child row data via Ajax.
Kevin