read datatable rows values to pass to google charts
read datatable rows values to pass to google charts
 cpshart
Posts: 250Questions: 50Answers: 6
cpshart
Posts: 250Questions: 50Answers: 6
Link to test case:
Debugger code (debug.datatables.net):
Error messages shown:
Description of problem:
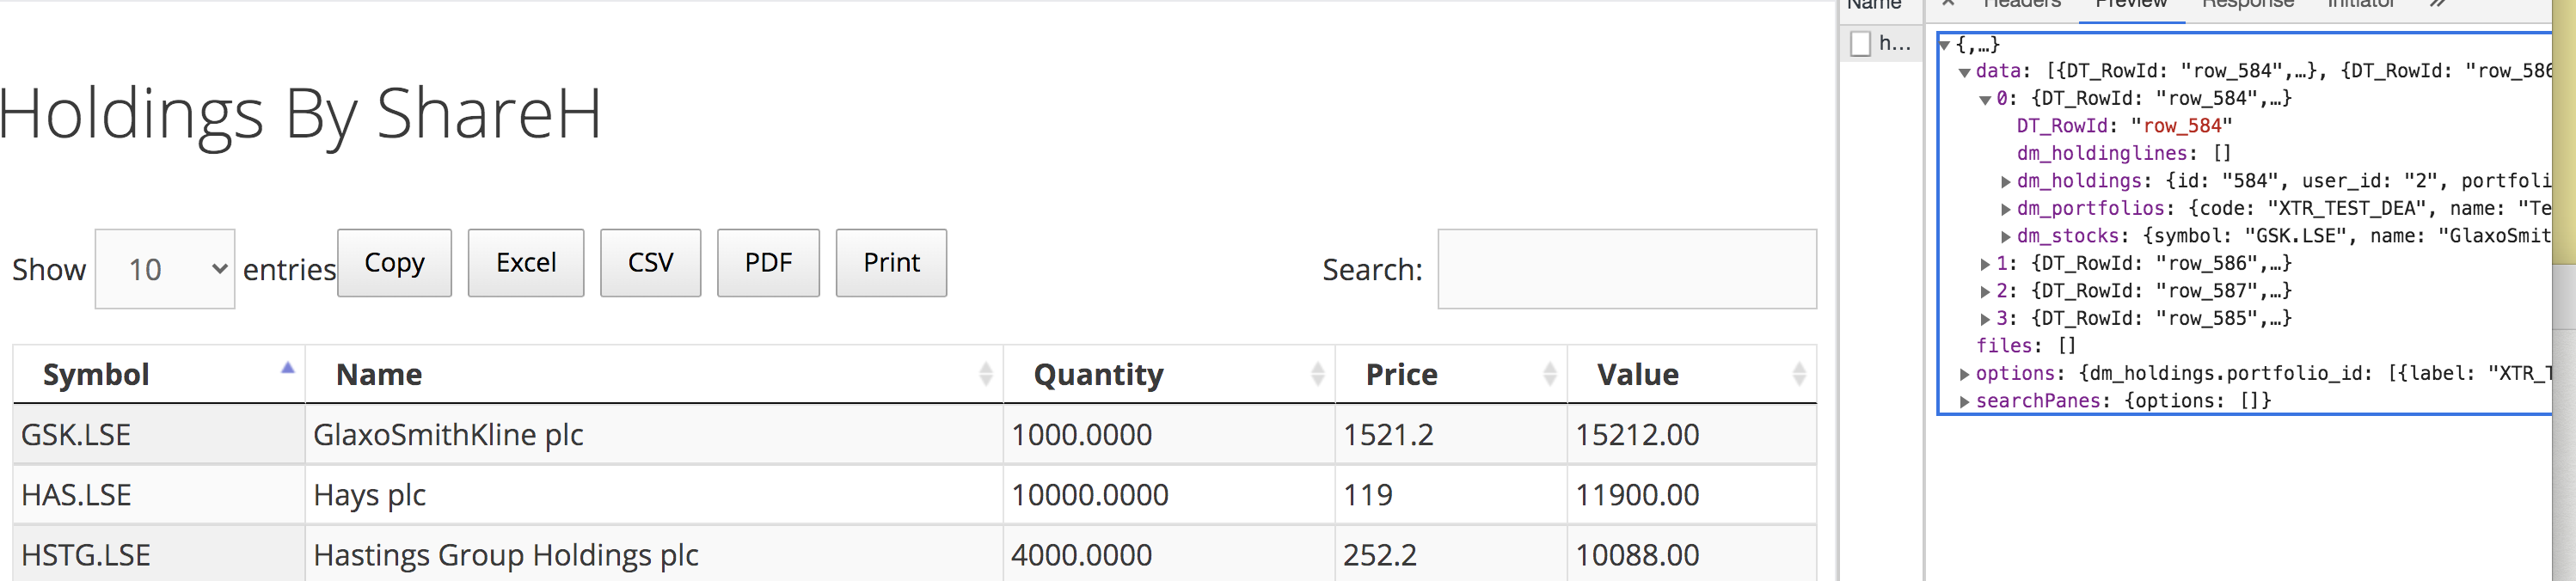
I am trying to get the column values for all rows created in the datatable using the following excerpt of code, I have added the majority of client code further below. The system is also available to check on my website if required. I intend to use the data to pass to the Google charts engine.
    var data = table
    .rows()
    .data();

alert( 'The table has '+data.length+' records' );


  // loop table rows
  table.rows({ search: "applied" }).every(function() {
    var data = this.data();
    var cell = table.cell(this.index(), 4).render('display');
console.log('cell value:'+cell);
console.log('data:'+data);
  }
The first alert returns 0
I am not however getting any data being returned, but it is displaying in the datatable and JSON from the server.
Let me know if you require access, as the site is password protected.
run the script here
https://www.dividendlook.co.uk/holdings-by-shareh/
client file
https://www.dividendlook.co.uk/wp-admin/post.php?post=26220&action=edit
main part of client script
<tr>
<th>Symbol</th>
<th>Name</th>
<th>Quantity</th>
<th>Price</th>
<th>Value</th>
</tr>

</tfoot>

<tbody>
<?php
global $wpdb;
global $current_user;
get_currentuserinfo();
$user_id = $current_user->ID;

$rows = $wpdb->get_results("
SELECT
        s.symbol AS symbol,
        s.name AS name,
        SUM(ANY_VALUE(h.quantity)) AS quantity,
        s.price AS price,
        IF(s.currency='GBX',(SUM(ANY_VALUE(h.quantity)) * ANY_VALUE(s.price) / 100)
        ,(SUM(ANY_VALUE(h.quantity)) * ANY_VALUE(s.price))) AS value

        FROM
        dm_holdings h
        INNER JOIN dm_stocks s ON (s.id = h.stock_id)
        INNER JOIN dm_portfolios p ON (p.id = h.portfolio_id)

        WHERE
        h.user_id >= IF(%CURRENT_USER_ID%=4,2,%CURRENT_USER_ID%)
        AND
        h.user_id <= IF(%CURRENT_USER_ID%=4,3,%CURRENT_USER_ID%)
        AND
        p.reporting_status = 'yes'
        GROUP BY
        s.symbol
");

foreach ($rows as $row ){
    echo "<tr>";
    echo "<td>$row->symbol</td>";
    echo "<td>$row->name</td>";
    echo "<td>$row->quantity</td>";
    echo "<td>$row->price</td>";
    echo "<td>$row->value</td>";
    echo "</tr>";
}


<?php
>


?>


<input type='hidden' id='passuserid' value='<?php echo $current_user->ID; ?>'>

<script type="text/javascript">
(function($) {

$(document).ready(function() {
var table = $('#holdings-by-shareh').DataTable( {
        orderCellsTop: true,
        fixedHeader: true,


        ordering: true,
        dom: "lBfrtip",
        "scrollY":      true,
        "scrollX":      true,
        ajax: {
        url:    "../../Editor-PHP-1.9.4/controllers/holdings_by_shareh.php",
        type: "post",
        data: function(d) {
            d.userid = $('#passuserid').val();
            }
        },
        columns: [
            { data: "dm_stocks.symbol" },
            { data: "dm_stocks.name" },
            { data: "dm_holdings.quantity" },
            { data: "dm_stocks.price" },
            { title: "Value", data: null,
                render: function ( data, type, row ) {
                    return (row.dm_stocks.currency == 'GBX')
                    ? (( Number(row.dm_stocks.price) * Number(row.dm_holdings.quantity) )  / 100 ).toFixed(2)
                    : ( Number(row.dm_stocks.price) * Number(row.dm_holdings.quantity) ).toFixed(2)
                }
            }
        ],
        columnDefs: [ // apply dt-nowrap to specific columns
          { className: "dt-nowrap", "targets": [ 1 ] }
    ]
} );

    var data = table
    .rows()
    .data();

alert( 'The table has '+data.length+' records' );


  // loop table rows
  table.rows({ search: "applied" }).every(function() {
    var data = this.data();
    var cell = table.cell(this.index(), 4).render('display');
console.log('cell value:'+cell);
console.log('data:'+data);
  }

} );

}(jQuery));</script>
Thanks for any help.
Colin
This question has accepted answers - jump to:
This discussion has been closed.
Answers
This is executing before Datatables has completed initialization. Meaning the Ajax request is asynchronous and the Javascript does't stop waiting on the response. You can put the code into
initCompelteor use a button click event to show the data. Basically you need to wait until Datatables has completed initialization before accessing the row data.Kevin
Hi Kevin
Many thanks for your very quick response, it now makes sense, I will integrate into my code and try and get the charts working !!
Best regards
Colin
Hi Kevin
Your solution has worked, with thanks and I am now trying to format the data to the required format for google charts by enclosing each x, y axis pair in square brackets followed by a comma of the form (including a x and y title) as follows
client code generating data for google chart
This part of code below
produces the data as follows
Problem
I need it to enclose the data in square brackets and add a comma between each row of data, and add a title for each axis as shown.
this extract of code works for producing a static google chart, I have commented out my section referencing my array which will replace the static section above when working
any help much appreciated.
Thanks
Colin
You are using a standard Javascript method to build the array, nothing Datatables specific. You are pushing an array of two elements onto the array so it should result in the array of arrays you want.
Where and how are you looking at this? Are you using a console.log statement right after the
dataArray.push([data.dm_stocks.symbol, parseFloat(cell)]);statement?Can you post a link to your page so we can take a look?
Kevin
Hi Kevin
I have PM'd you access to my site before, let me know if you need it again ?
run the script here
edit client script here
Yes the console.log statement is shown below
Many Thanks
Colin
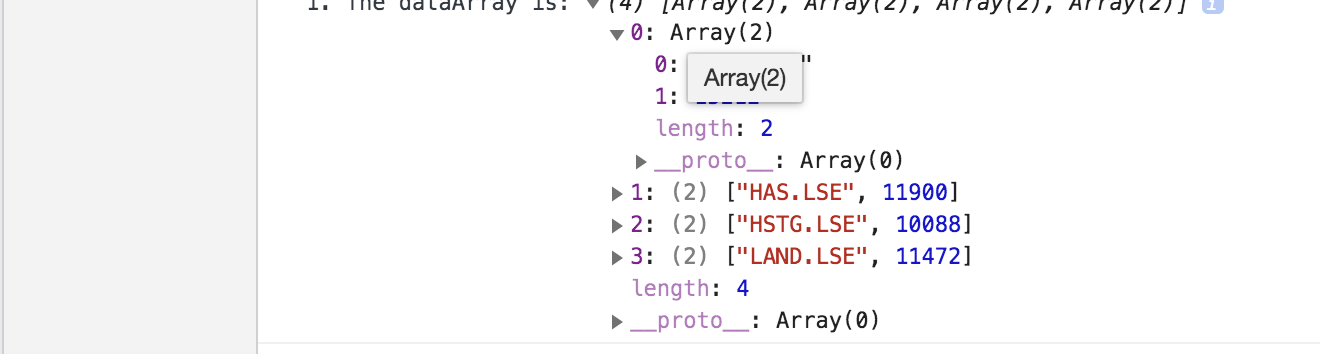
Using a debugger breakpoint I can see the array being built properly:
This produces a commas separated representation of the array. Not the actual array. I did something similar here:
http://live.datatables.net/gonicuyi/1/edit
Is there a problem you are trying to fix or is it just the output is incorrect?
Kevin
Hi Kevin
Thanks for looking at this, I see from your debugger that the data is in the correct format i.e. includes square brackets, I assume the output from console.log does not display the brackets, something I was unaware of, so I wrongly assumed the data was incorrect, sorry !!.
I need the data in this format to pass to the Google Chart engine, which I should now be able to complete the code.
Best regards.
Colin
If you look at the example I provided it shows to use a comma instead of a plus in the console.log statement.
Kevin
Hi Kevin
Sorry I have been out, that is useful to know, I have just tested console.log with a comma and it shows the square brackets so I see the data is correct, I am still trying to get it to produce a google chart, do you have an example using datatables data. I must be very close..
I am getting an error
which suggests that the numeric data (see attached) is being interpreted as a string
storing value as Float (tried parseInt, same error)
extract of Google Chart code, resulting in error above
if you have any ideas they would be welcome ..
Thanks Colin
There is nothing special about Datatables data. The blue numbers in your screenshot indicate these are numbers not strings. The problem, I think, is this code:
dataArrayis an array of arrays. I noted where you have extra set of[]. Which results in this:Remove the extra
[]. If you need to add["Symbol", "Value"]to the beginning of thedataArrayarray then use unshift().Kevin
Hi Kevin
Thanks for your quick response again, I am getting close to a solution for google charts, useful tips above.
I have just got highcharts working with datatables data using an array of arrays.
I will post the solution once done.
Best Colin