Uncaught ReferenceError: editor is not defined, using datatables editor, highcharts

Uncaught ReferenceError: editor is not defined, using datatables editor, highcharts

cpshartcpshart Posts: 246Questions: 49Answers: 5

Hi

I have just purchased the editor a couple of days ago, I am getting an error when trying to integrate, datatables highcharts and datatables editor.

**The error is Uncaught ReferenceError: editor is not defined
**

<script type="text/javascript"   src="https://code.jquery.com/jquery-3.3.1.js"></script>
<script type="text/javascript"   src="https://cdn.datatables.net/1.10.19/js/jquery.dataTables.min.js"></script>
<script type="text/javascript"   src="https://cdn.datatables.net/responsive/2.2.3/js/dataTables.responsive.min.js"></script>
<script type="text/javascript"   src="https://cdn.datatables.net/buttons/1.5.4/js/dataTables.buttons.min.js"></script>
<script type="text/javascript"   src="https://cdn.datatables.net/select/1.2.7/js/dataTables.select.min.js"></script>
<!-- sorting plugin reference https://datatables.net/plug-ins/sorting/natural -->   
<script type="text/javascript"   src="https://cdn.datatables.net/plug-ins/1.10.19/sorting/natural.js"></script>
<script type="text/javascript"   src="https://www.ukincomeinvestor.co.uk/Editor-1.8.1/js/dataTables.editor.js"></script>
    
<!-- extra js https://www.ukincomeinvestor.co.uk/Editor-PHP-1.8.1/examples/extensions/exportButtons.html -->
<script type="text/javascript"   src="https://cdnjs.cloudflare.com/ajax/libs/jszip/3.1.3/jszip.min.js"></script>
<script type="text/javascript"   src="https://cdnjs.cloudflare.com/ajax/libs/pdfmake/0.1.36/pdfmake.min.js"></script>
<script type="text/javascript"   src="https://cdnjs.cloudflare.com/ajax/libs/pdfmake/0.1.36/vfs_fonts.js"></script>
<script type="text/javascript"   src="https://cdn.datatables.net/buttons/1.5.4/js/buttons.html5.min.js"></script>
<script type="text/javascript"   src="https://cdn.datatables.net/buttons/1.5.4/js/buttons.print.min.js"></script>

<!-- HIGHCHARTS -->
<script type="text/javascript"   src="https://code.highcharts.com/highcharts.js"></script>
<script type="text/javascript"   src="https://code.highcharts.com/modules/no-data-to-display.js"></script>

I can include extracts of my PHP code if required, but I am hoping it is something to do with an incorrect sequence of javascript libraries.

Any help much appreciated.

Thanks Colin

This question has accepted answers - jump to:

Answers

  • cpshartcpshart Posts: 246Questions: 49Answers: 5

    I have moved the error on to

    Uncaught TypeError: Cannot read property 'i18n' of null


    by making the following change

    from

    //var editor; // use a global for the submit and return data rendering in the examples
        editor = new $.fn.dataTable.Editor( {
    

    to uncomment var declaration

    var editor; // use a global for the submit and return data rendering in the examples
        editor = new $.fn.dataTable.Editor( {
    

    so I will continue now to see what this error represents.

    Thanks Colin

  • cpshartcpshart Posts: 246Questions: 49Answers: 5
    <script type="text/javascript">
    (function($) {
    
    var editor; // use a global for the submit and return data rendering in the examples


    /* EDITOR SECTION MODAL */
    $(document).ready(function() {
        
    var editor; // use a global for the submit and return data rendering in the examples
    
        
        editor = new $.fn.dataTable.Editor( {
            ajax: {
                url: '../../Editor-PHP-1.8.1/controllers/cash_accounts_transactions.php',
                type: 'POST',
                data: function ( d ) {
                    d.userid = $('#passuserid').val();
                }
            },
            table: "#dt-table",
            fields: [ 
                {
                    label: "date time:",
                    name: "dm_cash_accounts_transactions.datetime",
                    def: function () { return new Date(); },
                    type: "datetime"
               }, {
                    label: "name:",
                    name: "dm_cash_accounts_transactions.name"
               }, {
                    label: "type:",
                    name: "dm_cash_accounts_transactions.type",
                    type:  "radio",
                    options: [
                        { label: "DEBIT", value: "DEBIT" },
                        { label: "CREDIT",   value: "CREDIT" }
                        ],
                    def: "DEBIT"
               }, {
                    label: "amount:",
                    name: "dm_cash_accounts_transactions.amount"
    .... etc.
    
                }
            ]
        } );


    init(); 
        
    });
    /* EDITOR SECTION MODAL */
        
    function init() {
      var table = $("#dt-table").DataTable( {
    
    // section 1


    // section 1


    /* INDIVIDUAL COLUMN SEARCHING (SELECT INPUTS) */     
    // Individual column searching (select inputs)
            initComplete: function () {
                // select column filter on columns 0, 1,2,3
                this.api().columns([5, 6, 7]).every( function () {
    
    ... etc. including highcharts code below


    The above code extract (plus highchart section) produces a datatable and highchart area chart with no console errors and no issues

    As soon as I add the datatables editor code to section 1 below, I get no console errors, but no chart data only the x and y axis legends but no chart.

    I then add the code to add, delete rows etc. shown at end


    select: true, buttons: [ { extend: "create", editor: editor, formButtons: [ 'Create', { text: 'Cancel', action: function () { this.close(); } } ] }, { extend: "edit", editor: editor, formButtons: [ 'Edit', { text: 'Cancel', action: function () { this.close(); } } ] }, { extend: "remove", editor: editor, formButtons: [ 'Delete', { text: 'Cancel', action: function () { this.close(); } } ] } ],

    select: true, buttons: [ { extend: "create", editor: editor, formButtons: [ 'Create', { text: 'Cancel', action: function () { this.close(); } } ] }, { extend: "edit", editor: editor, formButtons: [ 'Edit', { text: 'Cancel', action: function () { this.close(); } } ] } ],

    so if I add the above code it results in the following console error


    Uncaught TypeError: Cannot read property 'i18n' of null at text (dataTables.editor.js:7593) at k (dataTables.buttons.min.js:16) at r._buildButton (dataTables.buttons.min.js:17) at r._expandButton (dataTables.buttons.min.js:15) at r.add (dataTables.buttons.min.js:10) at r._constructor (dataTables.buttons.min.js:13) at new r (dataTables.buttons.min.js:9) at Object.fnInit (dataTables.buttons.min.js:44) at ob (jquery.dataTables.min.js:33) at ha (jquery.dataTables.min.js:48)

    So I wonder if it is possible to create an editor based datatable and create a highchart ?

    Thanks Colin

  • kthorngrenkthorngren Posts: 20,692Questions: 26Answers: 4,840

    Uncaught TypeError: Cannot read property 'i18n' of null

    I've seen this error if Datatables is initialized before Editor where the buttons config is referencing the editor variable but it's not been initialized with the Editor yet.

    If you continue to have difficulties maybe you can post your Datatables and Editor code.

    Kevin

  • cpshartcpshart Posts: 246Questions: 49Answers: 5

    Hi Kevin

    Thanks for your quick response, I have reduced the code size to provide an example where no errors are produced. With section 1 - section 1 editor code included the console shows no errors, but no area charts data is displayed.

    If I omit the code section 1 - section 1, there are no errors and thne area chart is displayed as expected.

    <html>
    <head>
    <title>DataTables Highcharts</title>
    <link rel="stylesheet" type="text/css" href="https://cdn.datatables.net/1.10.19/css/jquery.dataTables.min.css" />
    <link rel="stylesheet" type="text/css" href="https://cdn.datatables.net/buttons/1.5.4/css/buttons.dataTables.min.css" />    
    <link rel="stylesheet" type="text/css" href="https://cdn.datatables.net/select/1.2.7/css/select.dataTables.min.css" />  
    <link rel="stylesheet" type="text/css" href="https://www.ukincomeinvestor.co.uk/Editor-PHP-1.8.1/css/editor.dataTables.min.css">
    
    </head>
        <div id="chart"></div>    
    
        <div id="container">
            <table id="dt-table" class="table-striped table table-bordered" cellspacing="0" width="100%">
            <thead>
                <tr>
                    <th>Datetime</th>
                    <th>Name</th>
                    <th>Amount</th>
                </tr>
            </thead>
            <tbody>
    <?php
    global $wpdb;    
    global $current_user;
    get_currentuserinfo();
    $user_id = $current_user->ID;
    //    DATE_FORMAT(catr.datetime,'%d/%m/%y') AS datetime,
            
    $rows = $wpdb->get_results("
    SELECT
        catr.id AS id,
        catr.user_id AS user_id,
        catr.datetime AS datetime,
        catr.name AS name,
        catr.type AS type,
        catr.amount AS amount,
        ROUND(
            (
                catr.amount *(
                    CASE WHEN(
                        catr.type = 'CREDIT'
                    ) THEN 1 WHEN(
                        catr.type = 'DEBIT'
                    ) THEN -(1)
                END
            )
        ),
        2
    ) AS signedamount
    FROM
    dm_cash_accounts_transactions catr
    WHERE
    catr.user_id = 2
    ");
            
    foreach ($rows as $row ){
        echo "<tr>";
        echo "<td>$row->datetime</td>";
        echo "<td>$row->name</td>";
        echo "<td>$row->signedamount</td>";
       echo "</tr>";}
    
    <?php
    >      


    ?>
    
    
    <input type='hidden' id='passuserid' value='<?php echo $current_user->ID; ?>'>
    
    
    <script type="text/javascript"   src="https://code.jquery.com/jquery-3.3.1.js"></script>
    <script type="text/javascript"   src="https://cdn.datatables.net/1.10.19/js/jquery.dataTables.min.js"></script>
    <!--<script type="text/javascript"   src="https://cdn.datatables.net/responsive/2.2.3/js/dataTables.responsive.min.js"></script>
    -->
    <script type="text/javascript"   src="https://cdn.datatables.net/buttons/1.5.4/js/dataTables.buttons.min.js"></script>
    <script type="text/javascript"   src="https://cdn.datatables.net/select/1.2.7/js/dataTables.select.min.js"></script>
    <!-- sorting plugin reference https://datatables.net/plug-ins/sorting/natural -->   
    <script type="text/javascript"   src="https://cdn.datatables.net/plug-ins/1.10.19/sorting/natural.js"></script>
    <script type="text/javascript"   src="https://www.ukincomeinvestor.co.uk/Editor-1.8.1/js/dataTables.editor.js"></script>
        
    <!-- extra js https://www.ukincomeinvestor.co.uk/Editor-PHP-1.8.1/examples/extensions/exportButtons.html -->
    <script type="text/javascript"   src="https://cdnjs.cloudflare.com/ajax/libs/jszip/3.1.3/jszip.min.js"></script>
    <script type="text/javascript"   src="https://cdnjs.cloudflare.com/ajax/libs/pdfmake/0.1.36/pdfmake.min.js"></script>
    <script type="text/javascript"   src="https://cdnjs.cloudflare.com/ajax/libs/pdfmake/0.1.36/vfs_fonts.js"></script>
    <script type="text/javascript"   src="https://cdn.datatables.net/buttons/1.5.4/js/buttons.html5.min.js"></script>
    <script type="text/javascript"   src="https://cdn.datatables.net/buttons/1.5.4/js/buttons.print.min.js"></script>
    
    <!-- HIGHCHARTS -->
    <script type="text/javascript"   src="https://code.highcharts.com/highcharts.js"></script>
    <script type="text/javascript"   src="https://code.highcharts.com/modules/no-data-to-display.js"></script>
        
    <script type="text/javascript">
    (function($) {
    
    var editor; // use a global for the submit and return data rendering in the examples    
        
    /* EDITOR SECTION MODAL */
    $(document).ready(function() {
        
    //var editor; // use a global for the submit and return data rendering in the examples
    
        
        editor = new $.fn.dataTable.Editor( {
            ajax: {
                url: '../../Editor-PHP-1.8.1/controllers/cash_accounts_transactions.php',
                type: 'POST',
                data: function ( d ) {
                    d.userid = $('#passuserid').val();
                }
            },
            table: "#dt-table",
            fields: [ 
                {
                    label: "date time:",
                    name: "dm_cash_accounts_transactions.datetime",
                    def: function () { return new Date(); },
                    type: "datetime"
               }, {
                    label: "name:",
                    name: "dm_cash_accounts_transactions.name"
               }, {
                    label: "type:",
                    name: "dm_cash_accounts_transactions.type",
                    type:  "radio",
                    options: [
                        { label: "DEBIT", value: "DEBIT" },
                        { label: "CREDIT",   value: "CREDIT" }
                        ],
                    def: "DEBIT"
               }
            ]
        } );
        
    // call the init function   
    init(); 
        
    });
    /* EDITOR SECTION MODAL */
        
    function init() {
      var table = $("#dt-table").DataTable( {
    
    // try inserting here 1
    
             dom: "lBfrtip",
            ajax: {
                url: '../../Editor-PHP-1.8.1/controllers/cash_accounts_transactions.php',
                type: 'POST',
                data: function ( d ) {
                    d.userid = $('#passuserid').val();
                                    }
                },
            columnDefs: [
                { type: 'natural-desc', targets: '0' }
            ],
            columns: [
                { data: "dm_cash_accounts_transactions.datetime" },
                { data: "dm_cash_accounts_transactions.name" },
                { data:  null, // SignedAmount
                            render: function(data, type, row) {
                                if (row.dm_cash_accounts_transactions.type === 'CREDIT') {
                                return parseFloat(row.dm_cash_accounts_transactions.amount).toFixed(2); }   
                                else {
                                return 0 - parseFloat(row.dm_cash_accounts_transactions.amount).toFixed(2); }                                   
                                }                           
                }
            ],
        
            select: true,
            buttons: [
                { 
                    extend: "create", 
                    editor: editor, 
                    formButtons: [
                        'Create',
                        { text: 'Cancel', action: function () { this.close(); } }
                    ]
                },
                { 
                    extend: "edit",   
                    editor: editor, 
                    formButtons: [
                        'Edit',
                        { text: 'Cancel', action: function () { this.close(); } }
                    ]
                }
            ],      
                      
    
    // try inserting here 1
          
      });
        
        
      var tableData = getTableData(table);
      createHighcharts(tableData);
      setTableEvents(table);
    }   
    
    function getTableData(table) {
      var dataArray = [],
        datetimeArray = [], 
        nameArray = [], 
        signedamountArray = []
    
      // loop table rows
      table.rows({ search: "applied" }).every(function() {
        var data = this.data();
        datetimeArray.push(data[0]);
        nameArray.push(data[1]);
        signedamountArray.push(parseFloat(data[2]));
      });
     
      // store all data in dataArray
     dataArray.push(datetimeArray, nameArray, signedamountArray);
     
      return dataArray;
    }
    
    function createHighcharts(data) {
      Highcharts.setOptions({
        lang: {
          thousandsSep: ","
        }
      });
     
      Highcharts.chart("chart", {
        title: {
          text: "DataTables to Highcharts"
        },
        subtitle: {
          text: "Data cash accounts"
        },
          
          
        xAxis: [
          {
            categories: data[1],
            labels: {
              rotation: -45
            }
          }
        ],
        
        yAxis: [
          {
            // first yaxis
            title: {
              text: "Amount"
            }
          }
        ],  
        series: [
          {
            name: "Amount",
            color: "#0071A7",
            type: "area",
            data: data[2],
          }
        ],
        tooltip: {
          shared: true
        },
        legend: {
          backgroundColor: "#ececec",
          shadow: true
        },
        credits: {
          enabled: false
        },
        noData: {
          style: {
            fontSize: "16px"
          }
        }
      });
    }
    
    
    let draw = false;
     
    function setTableEvents(table) {
      // listen for page clicks
      table.on("page", () => {
        draw = true;
      });
     
      // listen for updates and adjust the chart accordingly
      table.on("draw", () => {
        if (draw) {
          draw = false;
        } else {
          var tableData = getTableData(table);
          createHighcharts(tableData);
        }
      });
    }   
    
        
    }(jQuery));</script>


    I will keep looking at the problem in light of your comments.

    Many Thanks

    Colin

  • kthorngrenkthorngren Posts: 20,692Questions: 26Answers: 4,840

    editor code included the console shows no errors, but no area charts data is displayed.

    Does this mean that the createHighcharts function does not run or that the data passed to the function is blank?

    My suggestion would be to put console.log statements in your functions to make sure they are running and are getting the correct data.

    This one would be very difficult to troubleshoot with an example to see what is happening.

    Kevin

  • cpshartcpshart Posts: 246Questions: 49Answers: 5

    Hi Kevin

    Thanks for your comments, I am quite new to Javascript, I should have been using console.log earlier for debugging, thanks for the tip, I will work on it later today and get back to you.

    Best Colin

  • cpshartcpshart Posts: 246Questions: 49Answers: 5

    Hi Kevin

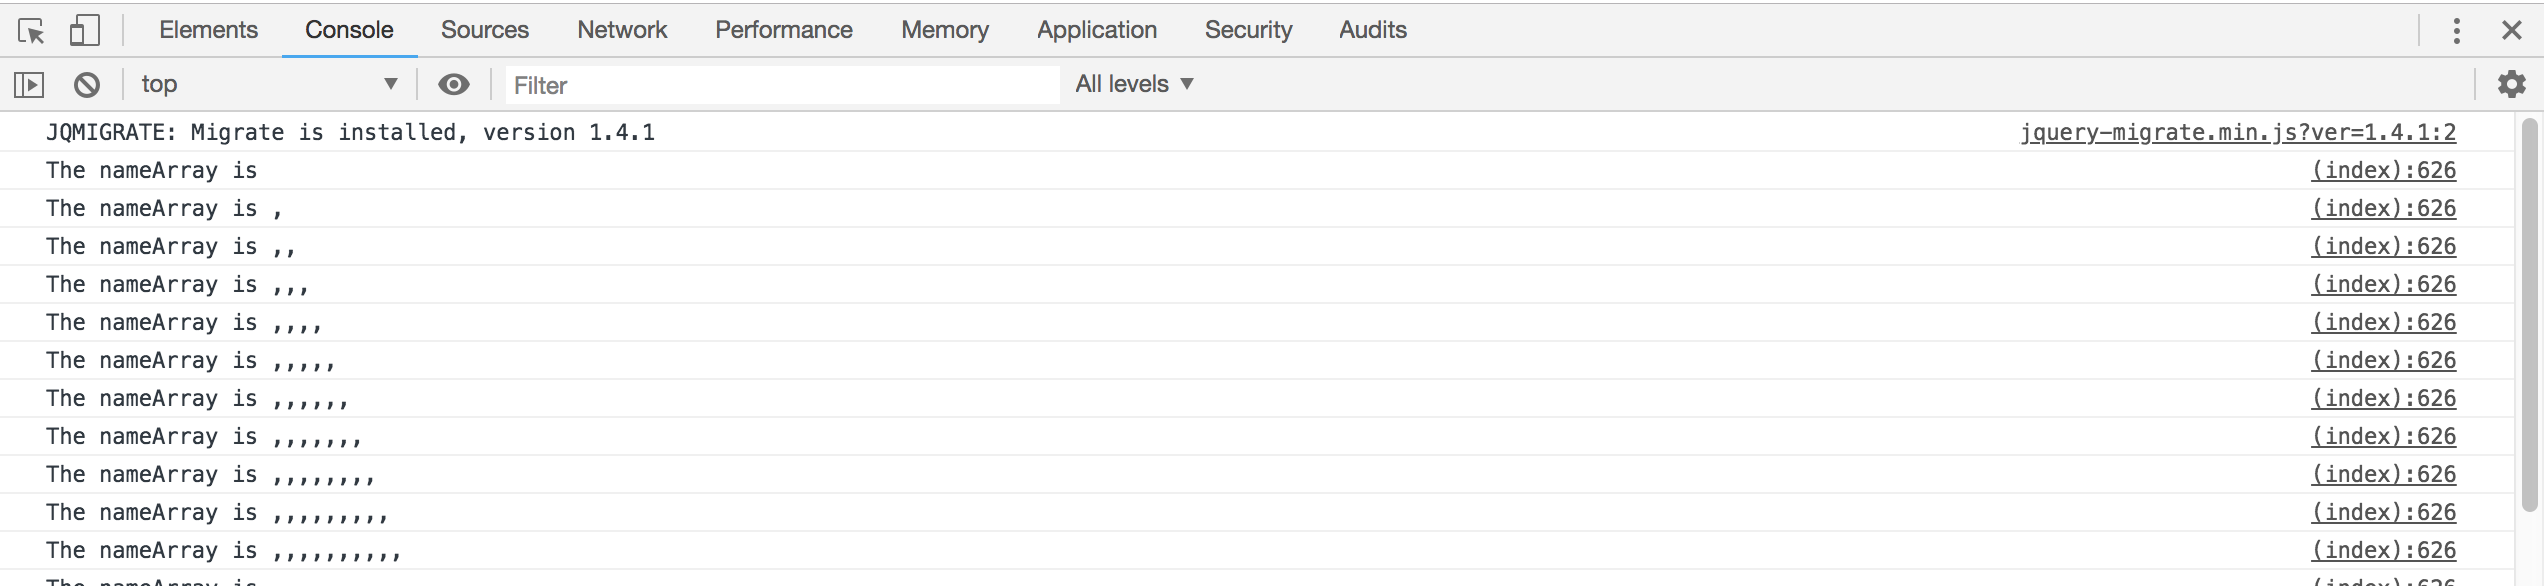
    I have just got back to the problem, as soon as I add the datatables editor code ( line 146-192 ) the JSON data for nameArray is not being populated, given by the console.log command shown below

      // loop table rows
      table.rows({ search: "applied" }).every(function() {
        var data = this.data();
        datetimeArray.push(data[0]);
        nameArray.push(data[1]);
        signedamountArray.push(parseFloat(data[2]));
      console.log("The nameArray is " + nameArray);
      });


    This is the console log showing no data, where editor code lines added

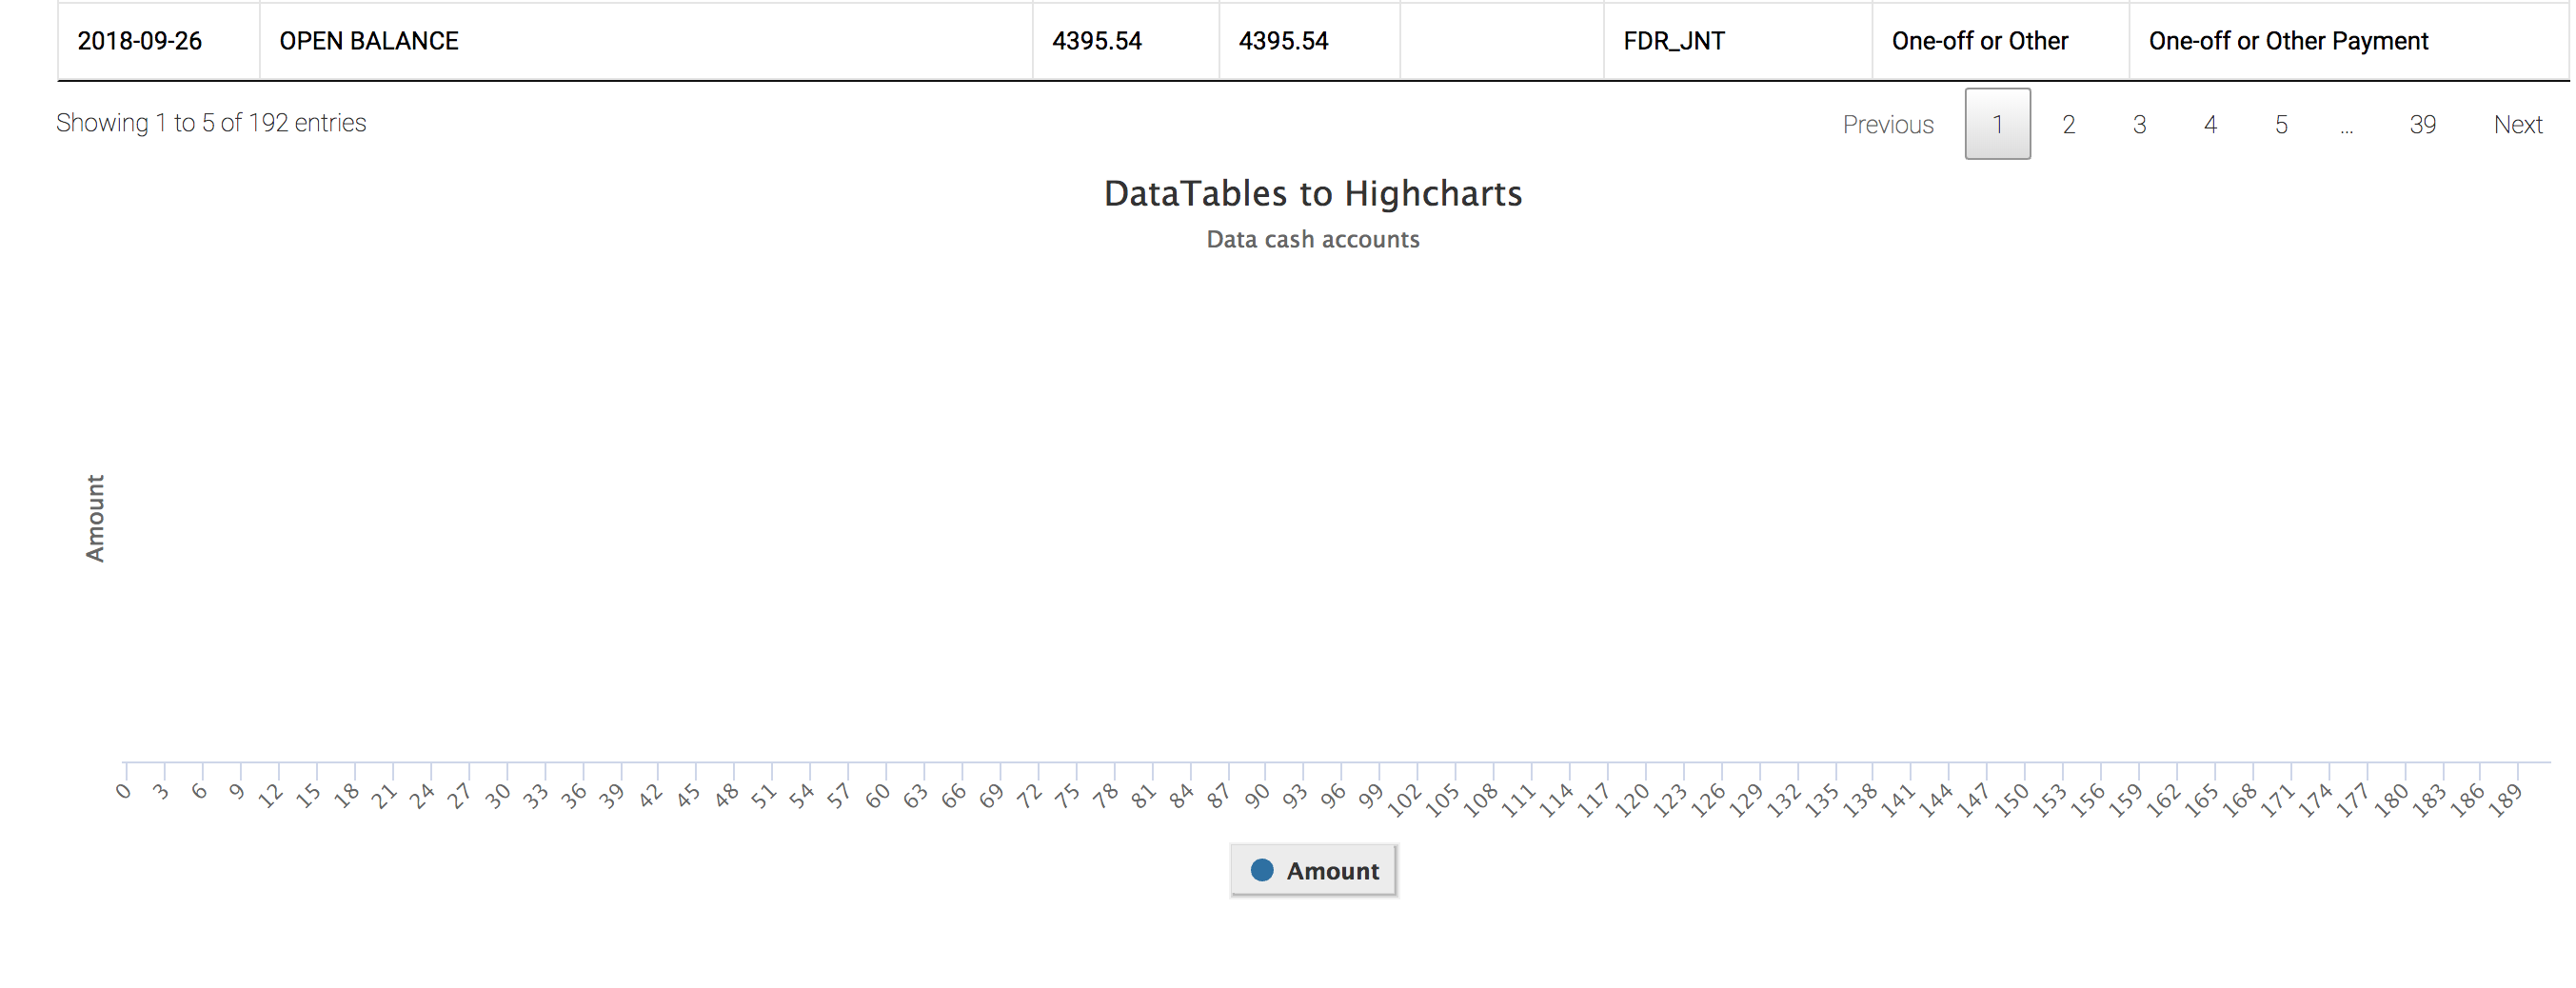
    This is the chart and bottom of table, where editor code lines added

    This is the chart and bottom of the table where the editor code lines have been removed, I have not shown all of the table as it is sensitive data.

    As shown above If I remove the section lines 146 -192, the JSON data is populated, the table is presented correctly and the Highcharts chart is displayed as expected.

    Any ideas would be much appreciated, as I need to be able to combine charting with the editor.

    Thanks Colin

  • kthorngrenkthorngren Posts: 20,692Questions: 26Answers: 4,840
    edited March 2019 Answer ✓

    Thanks for the clarification. When you mention Editor code I thought you meant the Editor init code in lines 106 - 135. The code in 146 - 192 is the Datatables init code. Now your question makes more sense.

    If you remove 146 - 192 then all you basically have is var table = $("#dt-table").DataTable( ); for a default Datatables initialization. This indicates to me that you already have an HTML table that Datatables is using. Datatables will process the HTML table and store the data in its cache using arrays.

    With lines 146 - 192, Datatables is now requesting the data via ajax then populating the table. You are using columns.data which now causes Datatables to store the data in its cache using objects. In this case you would change from using array notation like this datetimeArray.push(data[0]); to object notation like this datetimeArray.push(data[dm_cash_accounts_transactions.datetime]); or datetimeArray.push(data.dm_cash_accounts_transactions.datetime);.

    More info about the data structures here:
    https://datatables.net/manual/data/#Data-source-types

    See if this helps.

    Kevin

  • cpshartcpshart Posts: 246Questions: 49Answers: 5

    Hi Kevin

    Thanks, I have now read the link, and I have been working slowly through your manual pages to better understand the system.

    Brilliant, all working bar one small issue

    This notation worked, producing the JSON data

        datetimeArray.push(data.dm_cash_accounts_transactions.datetime);
    

    I can display the chart if I use say name vs amount value defined on the mysql table but I need to display the rendered value, signedamount, (shown in the SQL Query line 49, 214).

    How do I define this value using the above notation, as the following statement assigns a value of NaN to signedamount.

    I assume I need to use code from lines 202-209 at line 214, but I am unable to get this working.

    ``` js signedamountArray.push(parseFloat(data.dm_cash_accounts_transactions.signedamount));


    ``` js The signedamountArray is NaN,NaN,NaN,NaN,NaN,NaN,

    Many Thanks

    Colin

  • kthorngrenkthorngren Posts: 20,692Questions: 26Answers: 4,840
    Answer ✓

    You would use cell().render() to get the rendered value. You would change line 214 of your last code snippet from signedamountArray.push(parseFloat(data[2])); to something like this:

        var cell = table.cell(this.index(), 3).render('display');
        signedamountArray.push(parseFloat(cell));
    

    Here is a simple example based on your code:
    http://live.datatables.net/wusuteki/1/edit

    Kevin

  • cpshartcpshart Posts: 246Questions: 49Answers: 5

    Hi Kevin

    I have just added your suggestion, snippet below, changed the index offset to 2 and all works, great news.

      table.rows({ search: "applied" }).every(function() {
        var data = this.data();
        var cell = table.cell(this.index(), 2).render('display');
          
        datetimeArray.push(data.dm_cash_accounts_transactions.datetime);
        nameArray.push(data.dm_cash_accounts_transactions.name);
        signedamountArray.push(parseFloat(cell));  
    

    Many Thanks for your help.

    PS I do have 3 other queries which I will search again for answers off your forum, should I raise 3 more separate calls, if I cannot find answers. Then I should be in a position to develop all my known website pages.

    Best Regards

    Colin

  • kthorngrenkthorngren Posts: 20,692Questions: 26Answers: 4,840
    Answer ✓

    PS I do have 3 other queries which I will search again for answers off your forum, should I raise 3 more separate calls, if I cannot find answers.

    Its recommended to use new threads if the questions are different. This is good for not only specific help on a question but when doing searches later.

    Kevin

This discussion has been closed.