Problem updating highcharts in response to change in datatable
Problem updating highcharts in response to change in datatable
 cpshart
Posts: 250Questions: 50Answers: 6
cpshart
Posts: 250Questions: 50Answers: 6
Link to test case:
Debugger code (debug.datatables.net):
Error messages shown:
Description of problem:
Hi, I have combined 2 code snippets in my system to produce a highchart for my datatable
This code produces a selectable chart type Column, Bar etc.
https://codepen.io/knyshh/pen/aKEBRp
This code produces a highchart against the datatable and responds to changes in the datatable
https://webdesign.tutsplus.com/tutorials/data-visualization-with-datatablesjs-and-highchartsjs--cms-29691
I have produced code for my system to replicate each example, but I have a problem when combining the two, I can change the chart type, but I cannot figure out how to force a redraw of the chart on changes to the datatable. the issue is to do wit the function function setTableEvents(table) { is not being called.
I can provide access to my system to test if required.
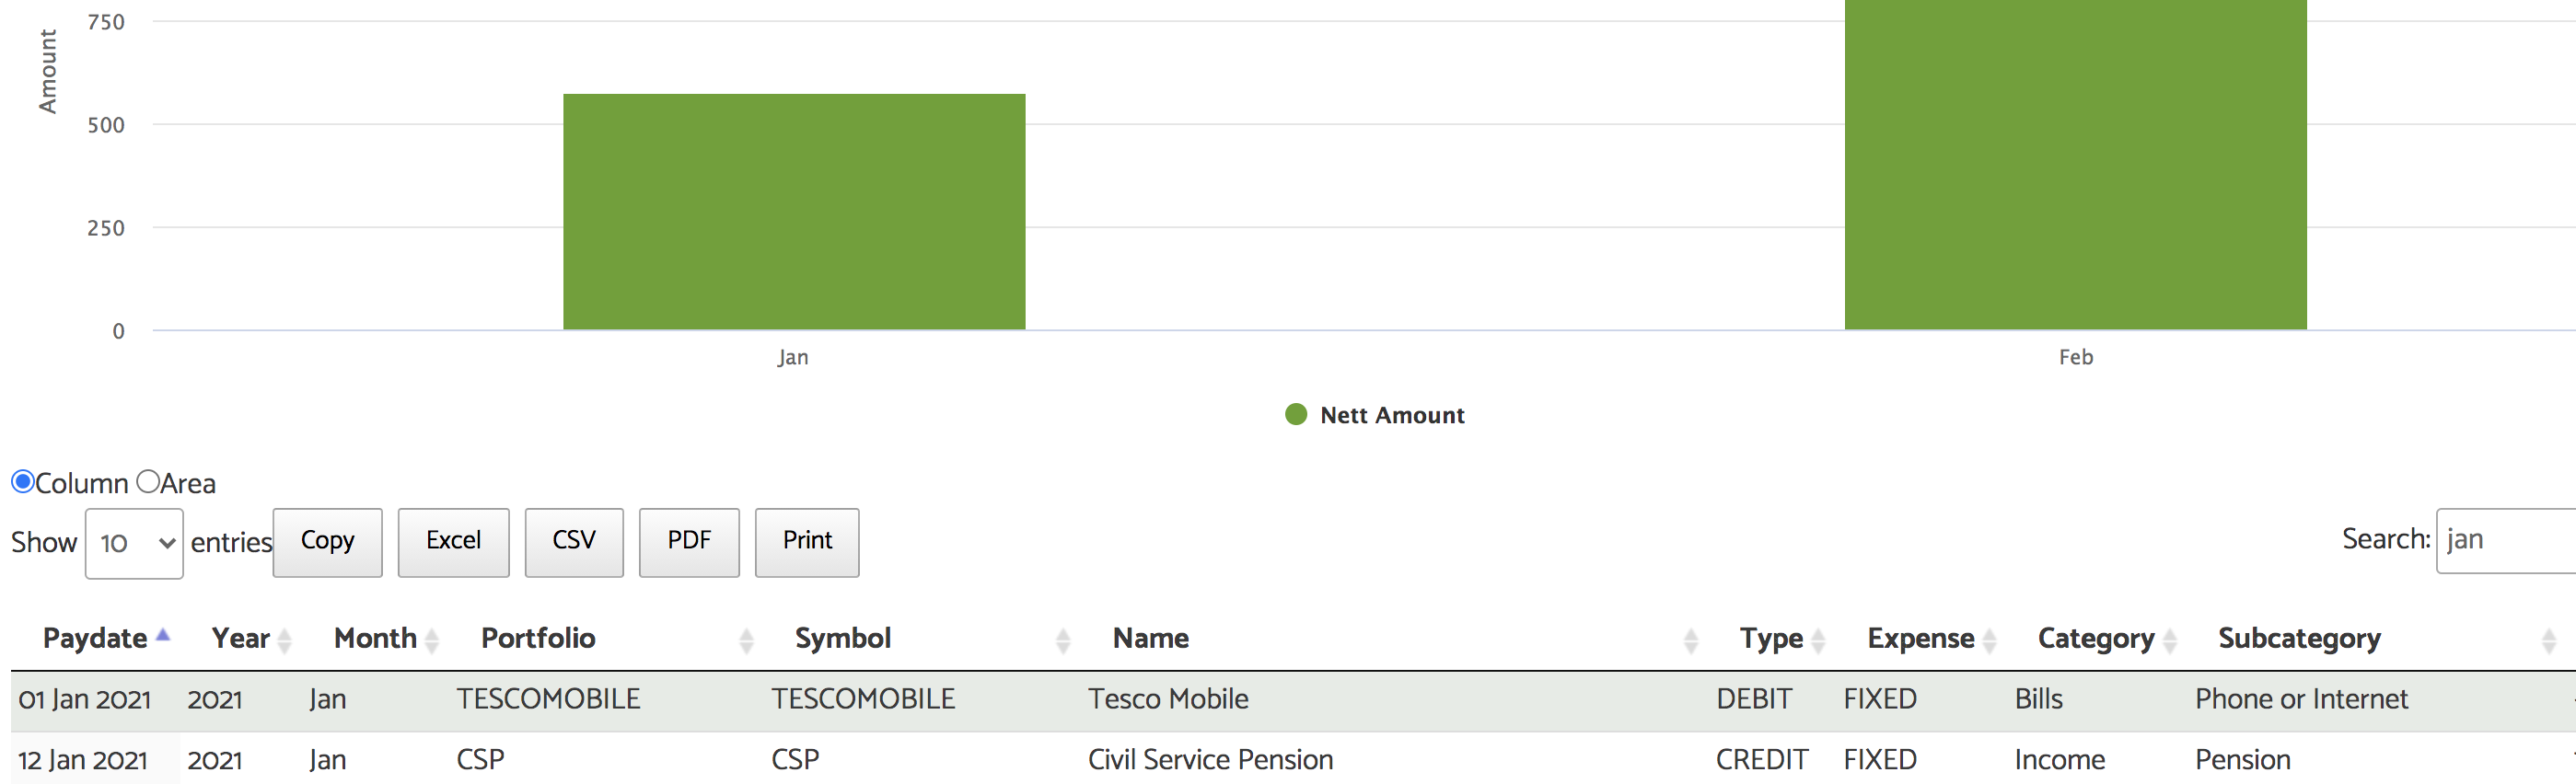
I have searched for Jan in datatable above, but the chart has not been updated to only show only Jan. However, the change of chart type works ok.
My script snippet is below
https://www.dividendview.co.uk/wp-admin/post.php?post=29992&action=edit
To run the script
https://www.dividendview.co.uk/income-payments-by-date-version-1-05/
Extracts of Snippet
<div id="container" style="min-width: 310px; height: 400px; margin: 0 auto"></div>
<input type="radio" name="mychart" class="mychart" id= "column" value="column" onclick= "chartfunc()" checked>Column
<input type="radio" name="mychart" class="mychart" id= "area" value="area" onclick= "chartfunc()">Area
<br>

<table id="income_paymentsbydate" class="display compact nowrap" style="width:100%">
<thead>

<tr>
<th>Paydate</th>
...

<th>Amount</th>
</tr>
<script type="text/javascript">
(function($) {

  $(document).ready(function(){
    $.fn.dataTable.moment( 'DD MMM YYYY' );

    // call the init function
    init();

  } );

function init()  {
    var table = $("#income_paymentsbydate").DataTable( {

        ordering: true,
        dom: 'lBfrtipP',
        searchPanes: {
          threshold: 1
        },
        "scrollY":      true,
        "scrollX":      true
} );

$(function () {

var data = getTableData(table);

// Create the chart

var options = {
    chart: {
       events: {
            drilldown: function (e) {
                if (!e.seriesOptions) {

                    var chart = this;
                   // Show the loading label
                    chart.showLoading('Loading ...');

                    setTimeout(function () {
                        chart.hideLoading();
                        chart.addSeriesAsDrilldown(e.point, series);
                    }, 1000);
                }

            }
        },
        plotBorderWidth: 0
    },

    title: {
        text: 'Income By Payments Date',
    },
    //
    subtitle: {
            text: ''
    },
    //
    xAxis: [
      {
        categories: ['Jan', 'Feb', 'Mar', 'Apr', 'May', 'Jun', 'Jul', 'Aug', 'Sep', 'Oct', 'Nov', 'Dec'],
      }
    ],
    yAxis: [
      {
        // first yaxis
        title: {
          text: "Amount"
        }
      }
    ],
    plotOptions: {
        column: {
            stacking: 'normal'
        }
    },
    //
    legend: {
        enabled: true,
    },
    //
    plotOptions: {
        series: {
            pointPadding: 0.2,
            borderWidth: 0,
            dataLabels: {
                enabled: false // default, enabled: true
            }
        },
    },
    //
     series: [{
        name: 'Nett Amount',
        colorByPoint: false,// sets multi color
        data: data,
        color: '#65a125'
    }],
    //
    drilldown: {
        series: []
    }
};

// Column chart
options.chart.renderTo = 'container';
options.chart.type = 'column';
var chart1 = new Highcharts.Chart(options);

chartfunc = function()
{
var column = document.getElementById('column');
var area = document.getElementById('area');

if(column.checked)
    {
        options.chart.renderTo = 'container';
        options.chart.type = 'column';
        var chart1 = new Highcharts.Chart(options);
    }
else if(area.checked)
    {
        options.chart.renderTo = 'container';
        options.chart.type = 'area';
        var chart1 = new Highcharts.Chart(options);
    }
}

/* new highcharts code here */
var data = getTableData(table);
chartfunc();
setTableEvents(table);

});

function getTableData(table) {

var amountMonthArray = [];

var data = table.rows().data();

var Jan = 0;
var Feb = 0;


  // loop table rows
  table.rows({ search: "applied" }).every(function() {
    var data = this.data();
    var cellPdate = table.cell(this.index(), 0).render('display');
    var cellAmount = table.cell(this.index(), 10).render('display');

      var Pdate = new Date(cellPdate);
      switch (Pdate.getMonth()) {
          case 0: // Jan
              Jan = parseFloat(cellAmount) + parseFloat(Jan);
              break;
          case 1: // Feb
              Feb = parseFloat(cellAmount) + parseFloat(Feb);
              break;
      }
  });
    amountMonthArray.push(Jan);
    amountMonthArray.push(Feb);

  return amountMonthArray;
}


let draw = false;

function setTableEvents(table) {
  // listen for page clicks
  table.on("page", () => {
    draw = true;
  });

  // listen for updates and adjust the chart accordingly
  table.on("draw", () => {
    if (draw) {
      draw = false;
    } else {
      data = getTableData(table);
        chartfunc();
    }
  });
}

};

}(jQuery));</script>
Any help much appreciated.
Thanks Colin
This question has accepted answers - jump to:
Answers
I think the problem is you are creating the variable
tableinside the scope of theinit()function. So what you callsetTableEvents(table);thetablevariable doesn't exists. Do you get errors in the browser's console?When you say
setTableEvents()isn't called do you mean in line 131 fails or do you mean the event handlers insetTableEvents()aren't triggered? Try some console.log statements inside the event handlers to see if the are fired.Maybe you need to use another selector for the events. Maybe this if
tableisn't working:Or you may need to include the
dtnamespace like this:The same goes for the
drawevent in that function.Kevin
Hi Kevin
Thanks for the response, the function
setTableEvents(table) {is only being called on the first draw of the chart.I made the change above but, I have debugged and the data value is being populated correctly when I filter the table, but the function above is not being called after applying a filter, so the chart remains unchanged.
I am not sure where I need to call the function in the code, all my attempts have failed.
I hope this makes sense.
Thanks Colin
We're happy to take a look, but as per the forum rules, please link to a test case - a test case that replicates the issue will ensure you'll get a quick and accurate response. Information on how to create a test case (if you aren't able to link to the page you are working on) is available here.
Cheers,
Colin
Hi colin
Thanks for your response, I have sent you a PM with my website access details.
Best Regards
Colin
Hi colin
I just thought I would check if you have received my private message and a chance to look at my problem, with thanks.
Best regards
Colin