Need help with Datatables and Highcharts
Need help with Datatables and Highcharts
 Noodles12
Posts: 115Questions: 42Answers: 2
Noodles12
Posts: 115Questions: 42Answers: 2
I have the following test case. Please see my test case in the following link
http://live.datatables.net/febayaxa/1/edit
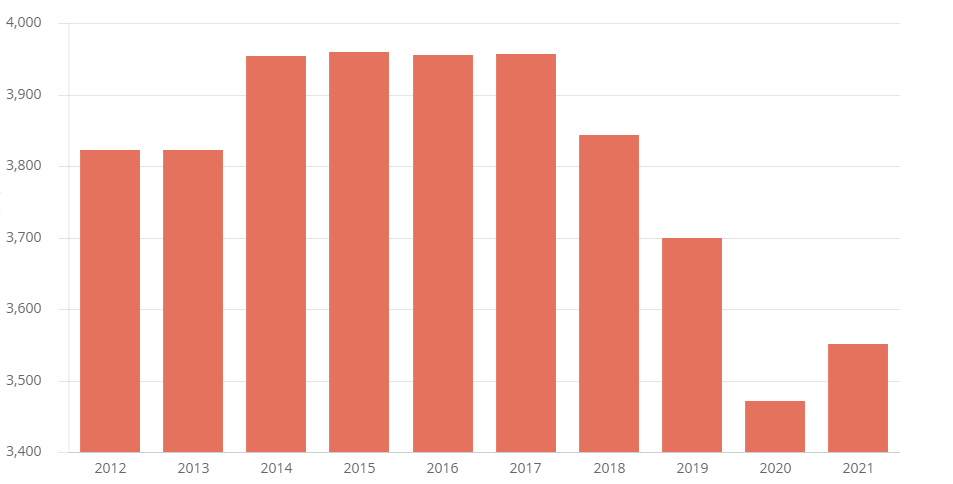
How can I get graph to show like this? I want years in Y axis. Thanks.
This question has an accepted answers - jump to answer
This discussion has been closed.
Answers
Looks like the code you are using is from this blog. For that code yo work you would need to change your table to show one row for each year instead of one row for all years.
For the one row all you need to do is map the column header to the cell data, like this:
http://live.datatables.net/febayaxa/2/edit
Kevin
Thankyou, It looks great!