Total of values in Highcharts
Total of values in Highcharts
 carrarachristophe
Posts: 126Questions: 30Answers: 2
carrarachristophe
Posts: 126Questions: 30Answers: 2
in DataTables
Link to test case:
Debugger code (debug.datatables.net):
Error messages shown:
Description of problem:
Hello,
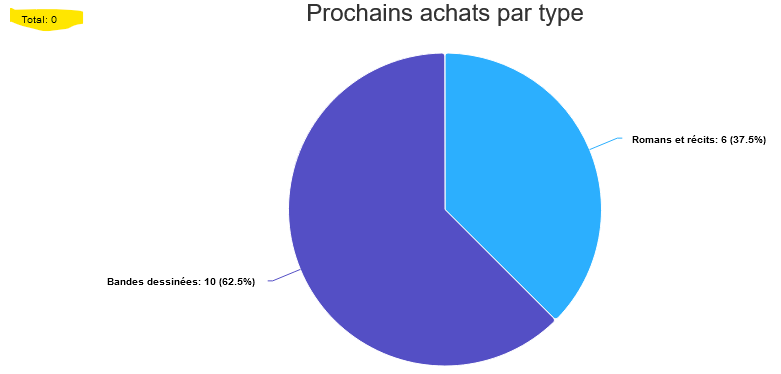
I am using Highcharts and am able to display the Datatable data in a pie chart.
What I am trying to do now is to add the total number of records displayed in the datatable somewhere in the Highcharts.
There are a couple of Stackoverflow cases like this one or that one and this is a working example with the total in the top left corner.
I fail to do the same and only get the following: Total: 0.
Here is my code
    var chart_type = Highcharts.chart("container_type", {
        chart: {
            type: 'pie',
            events: {
                load: function(event) {
                    var total = 0; // get total of data
                    for (var i = 0, len = this.series[0].yData.length; i < len; i++) {
                        total += this.series[0].yData[i];
                    }
                    var text = this.renderer.text(
                        'Total: ' + total,
                        this.plotLeft,
                        this.plotTop - 20
                    ).attr({
                        zIndex: 5
                    }).add() // write it to the upper left hand corner              }
                }
            },
        title: {
            text: 'Prochains achats par type',
            align: 'center',
            style: {
                font: '24px "Helvetica Neue", Helvetica, Arial, sans-serif'
            }
        },
        series: [
            {
                data: chartData_type(table),
                name: 'Voeux',
            },
        ],
        plotOptions: {
            pie: {
                allowPointSelect: true,
                cursor: 'pointer',
                dataLabels: {
                    enabled: true,
                    format: '<b>{point.name}</b>: {point.y} ({point.percentage:.1f}%)',
                    style: {
                        font: '14px "Helvetica Neue", Helvetica, Arial, sans-serif'
                    }
                }
            }
        }
    });

function chartData_type(table) {
    var counts = {};

    // Count the number of entries for each position
    table
        .column(4, { search: 'applied' })
        .data()
        .each(function (val) {
            if (counts[val]) {
                counts[val] += 1    ;
            } else {
                counts[val] = 1;
            }
        });

    // And map it to the format highcharts uses
    return $.map(counts, function (val, key) {
        return {
            name: key,
            y: val,
        };
    });
}
Any idea of what is wrong?
This question has an accepted answers - jump to answer
This discussion has been closed.
Answers
I'm guessing this is the code in question:
Doesn't look like there is anything Datatables specific in the code or question. You might be getting the data from Datatables but the question is specific to Highcharts. I would first start by debugging the function to find out what
this.series[0]contains. From there you should be able to determine what you need to use to get the data total. You will need to refer to Highcharts docs, the Highcharts forum and/or Stack Overflow for Highcharts specific questions.Maybe load isn't the correct event depending on when the cart is initially created. Maybe you need another event like
redraw.Kevin
Hi Kevin,
Thanks for your message.
I guess this is the part that was missing in my code above, and that is drawing the Highchart based on the Datatable:
I activated the Highcharts debugger but not getting any error message.
Please link to a test case showing the issue so we can take a look.
Allan
Dear Kevin and Allan,
Thanks a lot for your help.
I found this interesting post and was able to solve my issue with below code.
Basically it includes
render(no need ofloadorredraw) and thesetTitlefunction, and only styling in the title part as the title is defined in the chart/events part.