Memory leak searchPanes.rebuildPanes()
Memory leak searchPanes.rebuildPanes()
 glimpsed_chaos
Posts: 143Questions: 31Answers: 4
glimpsed_chaos
Posts: 143Questions: 31Answers: 4
Link to test case: https://live.datatables.net/qemexuzi/3/
Error messages shown: No error, memory increases steadily with each rebuildPanes()
Description of problem: Checking the browser task manager, it can be observed in my test case that each update increases memory usage.
Basic scenario - My client receives a JSON object (serialized) from the server. This data is then JSON.parse and used as the new data set for the table. This requires the table to be cleared and redrawn. In addition, I have searchPanes enabled. In order to account for new data that also needs to be in the searchPanes I have to rebuild the searchPanes.
To eliminate other options as a culprit of the memory issue, I started small and worked my way up testing as follows:
Starting with a basic initialization and loading data from an array I ran about 50k iterations. No real memory increase (about 100k)
Adding in SearchPanes, Select and testing for about 50k iterations also resulted in no unexpected memory increase. Normal amount with the new features enabled. Around 120k.
Adding in Scroller and testing for about 50k iterations also resulted in no unexpected memory increase. Normal amount with the new feature enabled. Around 120k.
Adding the ".searchPanes.rebuildPane()" option, to keep any new data available in the searchPanes however starts to show near immediate increase in memory. After just 700+ iterations memory has gone from about 120k to 411k, JavaScript memory has also steadily increased to about 94k. About 11 minutes. If I were to run this for a 50k iteration cycle it would probably crash my browser.
Any thoughts on how I can resolve? If I am doing something wrong with the ".searchPanes.rebuildPane()"?
My test case runs every 1 second to help push the issue. Real world, I run every 5 seconds so we can provide near real-time updates. But even slowing this in my real world to 30 seconds I can recreate (just takes longer) but it happens.
Thanks for your time.
This question has accepted answers - jump to:
Answers
I had to fix the test case the prior one was running out of control - https://live.datatables.net/qemexuzi/5/
This one has AutoRun unchecked, so you have to start manually when you are ready to review.
I have searched here for anything historically related to "memory leak". Nothing related to searchPanes that either has not already been addressed or settings I don't have in place that I can determine.
Any thoughts on how to resolve the growing memory issue?
Starting out the memory is at 121,364k as shown in this image: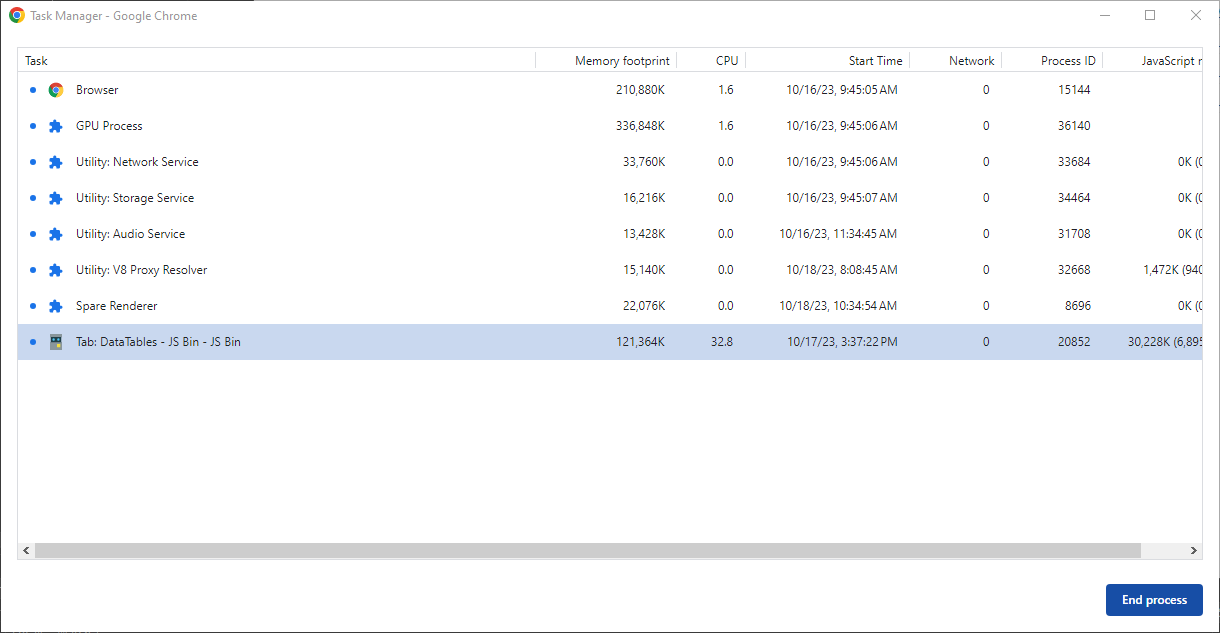
After 10 minutes (617 updates) the memory usage is at 432,052k as shown in this image: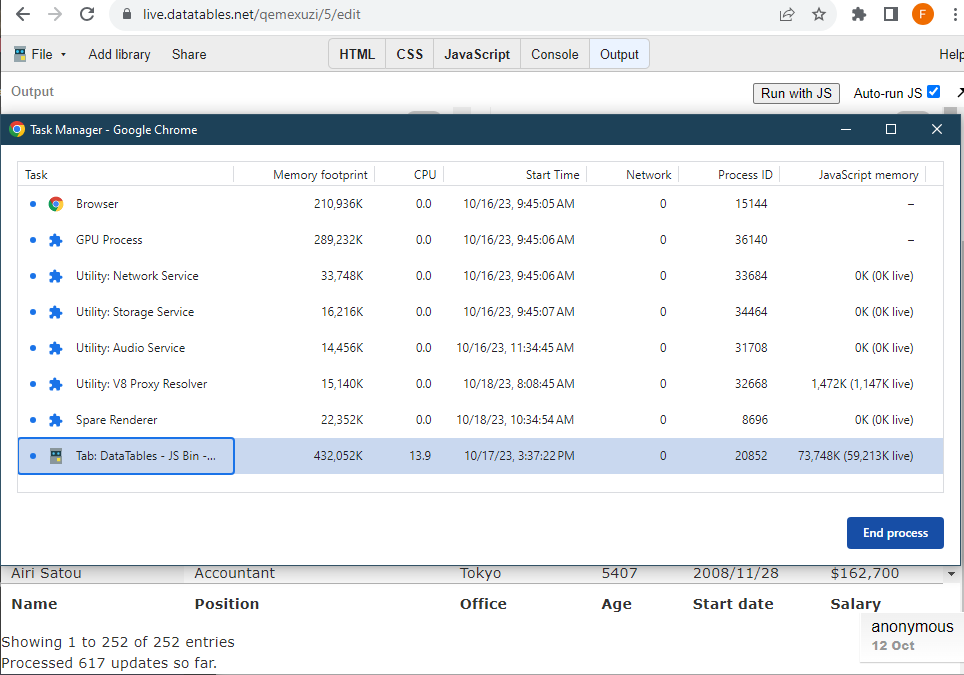
If I remove the .searchPanes.rebuildPane() then the memory build up like this does not occur.
Tested with Chrome - Version 118.0.5993.89 (Official Build) (64-bit) and Edge - Version 116.0.1938.81 (Official build) (64-bit).
Is there any other information I can provide for determining the if I have a setting wrong/not applied or some other issue?
To be clear, this only occurs when .searchPanes.rebuildPane() is used.
Changing the configuration slightly to use a button enabled searchPanes here results no memory growth.
However, upon clicking the button to actually show the searchPanes, the memory begins to increase as noted before.
Upon closing the searchPanes I can observe the memory usage decrease down to an expected value.
So, it appears that their might be a memory leak or other issue when the searchPanes are actually displayed. Again, this is with the rebuildPane() in use. It occurs slowly if updated slowly (say 20 to 30 second interval) but it does eventually create an unstable memory usage in the browser. My demo runs every 1 second to show the issue somewhat right away.
I tried getting a debug on it but that generates errors, which I also asked about in a separate question.
After letting it run about 90 minutes, memory still creeped.
As long as I never click the button to open the searchPanes, the memory creep does not appear. I am currently at 547 updates (just over 9 minutes) and sitting around 65,020k memory footprint, as expected.
Any help would be appreciated but I don't think it is anything I have configured/not configured. This appears to be a memory leak / bug within searchPanes.rebuild.
Just to be sure... here is a snapshot of the memory after another 90+ minutes. However, this time I never opened/clicked the button to show the searchPanes. Less than 100k memory usage is well within norms/expectations. 1,000k+ memory usage is not acceptable.
Apologies that you've been left on your own here. I'm in the middle of a few other things at the moment, and I suspect this isn't going to be a quick diagnosis / fix, so I'll need to circle back to it. First still will be to bring the test case out of JSBin (thanks for the test case btw!) to make sure that isn't effecting it at all.
Allan
Thanks @allan. Just getting eyes on it to verify if it is a bug is great.
It's understandable that this won't be quick. I just wanted to be sure there was something I had not done incorrectly in the setup that would create the issue.
Thanks for your assistance!
@allan In trying for a solution, for now, that would work I may have something.
I updated the test case here to use a button, instead of showing the collapsed pane. This means a modal of course will be displayed. Prior testing like this still created a memory issue.
The only different option set here is that use the rebuildPane([1,2],true) instead of just rebuildPane();
I ran nearly 8,000 iterations and it bounces between 130k to 160k, which is acceptable.
I am going to test that with the displayed but collapsed setup and see if that helps my original scenario.
@allan Okay, so last update for now I think.
It appears that using rebuildPane([1,2],true) is actually helpful in my original scenario. I ran another 5400+ iterations and the memory usage bounces between about 140,000k up to 190,000k. Looks like the high points are awaiting garbage collection and the lower points are after that collection.
Updated test case: https://live.datatables.net/qemexuzi/9/
I don't know if that solves or helps anything overall for you. The problem persists without the column and true flag set. Maybe that helps determine how it could be fixed when not using those options.
For now, I believe those settings are usable for me.
Thanks again for your time.
Hi,
I've just been looking into this, but I'm actually struggling to reproduce the error I'm afraid. I've taken the code from https://live.datatables.net/qemexuzi/5/ which uses
searchPanes.rebuildPane(). I've put it onto a static page here: http://datatables.net/dev/memory-77347.html .In Chrome if I take a stack heap and then in a few minutes take another and do a comparison it show 0 delta in the number of HTML elements. If there was a memory leak in SearchPanes I'd expect to see that growing over time. Likewise the other parameters appear to be fairly settled.
I've tried watching the memory usage of Chrome in
topas well, and it is holding steady after reaching an equilibrium point. I should note that I'm using Linux, so perhaps there is a Windows / Linux difference from Chrome...Do you see constant memory instead with the static page I made?
Thanks,
Allan
@allan,
Not when I observer your static page. However, I did notice that your static page does not appear to actually have the searchPanes enabled. Can you enable? I also added the ([1,2], true) to the rebuildPanes.
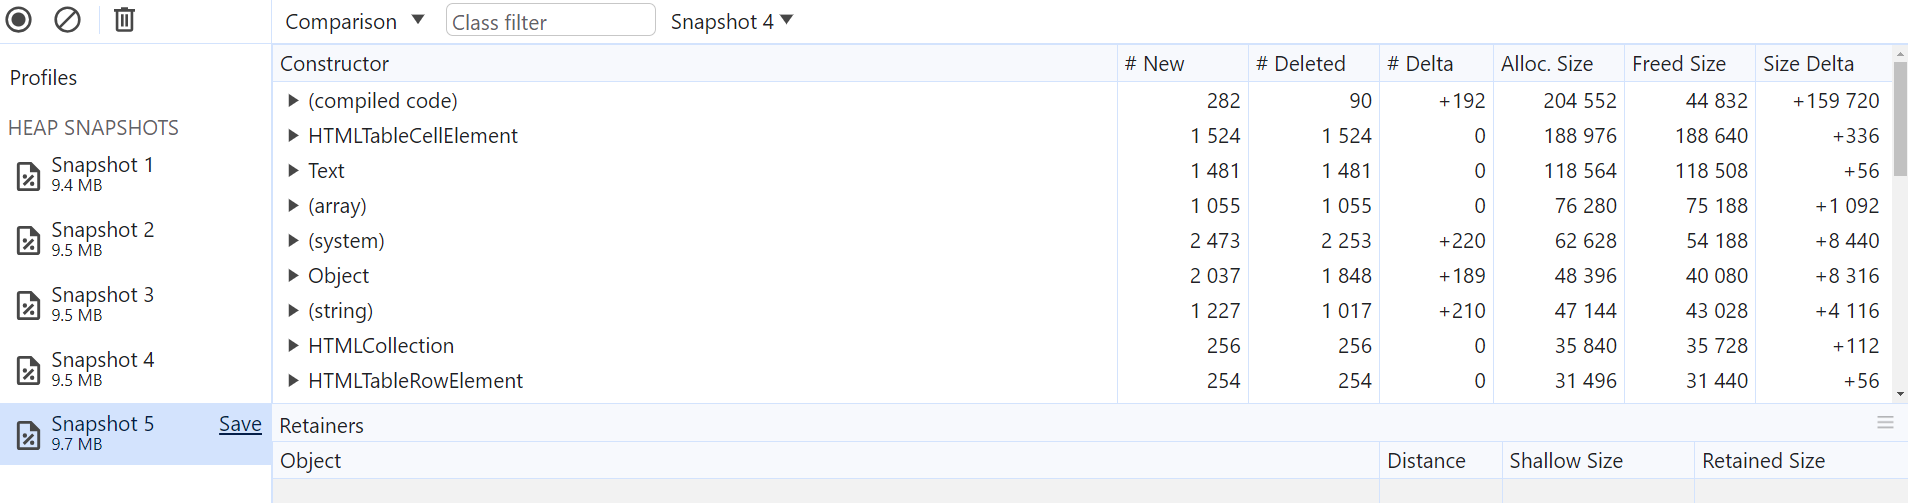
Checking the same with my test case and I do see some +/- in the HTMLCollection and HTMLTableRowElement. I just had to smash the "Take a heap snapshot" button a few times to catch the change. It appears the same number that gets added also gets removed.
Thank you for looking into this.
On my phone at the moment and JSBin doesn't work well with mobile, but so I've got the right starting point when I look at this next, which of the JSBins should I use to see the memory leak?
If it is keeping Dom nodes, then that is certainly an issue that needs to be corrected!
Allan
@allan - No worries.
Here's an example, again have to take some rapid fire snaps. Should see it added and removing the same number of nodes.
Running on this test case - https://live.datatables.net/qemexuzi/18/
Awesome - thank you. I think I see the issue - a couple of event handlers not being let go. Unfortunately my main computer is down at the moment - power cut here. I'll fix that issue and see how it does once the power is back on!
Allan
Hi,
I've just committed a few changes to SearchPanes that I think address the event handler issue. The latest nightly carries those changes.
The updated live example appears to be stable over time now, memory-wise (the only update was to include an anti-cache
?in the URL for the nightly file).Allan
@allan
Using your live example I ran the same scenario I had been running. Nearly 7,000 iterations for about 2 hours. Very stable with memory around 107,048k.
Thank you so much for fixing this quickly!
Excellent - thanks for the confirmation! I'll get that tagged up and released soon. Are you okay using the nightly at the moment, or do you need it in npm?
Allan
@Allen
I am good at the moment with the nightly.
Can I assume, that I can just grab the searchPanes.min.js from the nightly and replace it in the concatenated download I normally use?
Correct")
Allan
@allan Thanks again! I have it in the concatenated file now and after a 3 hour run in our application this is working fantastic. Appreciate your attention to that!