counting with conditions in footer/header callback
counting with conditions in footer/header callback
 MelodyNelson
Posts: 213Questions: 33Answers: 2
MelodyNelson
Posts: 213Questions: 33Answers: 2
Link to test case:
Debugger code (debug.datatables.net):
Error messages shown:
Description of problem:
Hi,
I have another tricky question for my « level », wondering what approach should I use.
I need to make 3 totals in a table containing invoices :
- total to be paid (total en-cours, column restant dû, in french in the example below)
- total not paid, and the due date has passed (in red in the example)
- total not paid, not late, the due date is >= today (in green in the example)
The accountant need to have the infos (+ the number of invoices) at the beginning of the table.
If a search or filter is used, the totals should be updated.
If I'm using footer or header callback, I can easily have the result for all the invoices shown in the table.
I'm already doing it like that but I don't know :
- how I can count the « red total » and the « green total » depending on the due date inside the footerCallback
- how to place it in the right place in the HTML header of the table.
footerCallback: function (row, data, start, end, display) {
        var api = this.api();
        var pageInfo = api.page.info();

        // totaux (ensemble des mouvements, après filtres éventuels)
        totalGeneralTTC = api
            .column(11, { page: 'current' })
            .data()
            .reduce(function (a, b) {
                return a + b * 1;
            }, 0);

        totalGeneralRestant = api
            .column(12, { page: 'current' })
            .data()
            .reduce(function (a, b) {
                return a + b * 1;
            }, 0);

        // number formatter : DataTable.render.number(thousands, decimal, precision, prefix, postfix)
        totalGeneralTTC = DataTable.render.number(' ', null, 2, null, '').display(totalGeneralTTC);
        totalGeneralRestant = DataTable.render.number(' ', null, 2, null, '').display(totalGeneralRestant);

        // FIRST TOTAL FOR THE HEADER (ALL INVOICES FILTERED)
        totalAll = totalGeneralRestant;

        var labelTotal = 'TOTAL FACTURES (' + pageInfo.recordsDisplay + ')';

        // update footer
        $(api.column(1).footer()).html(labelTotal);
        $(api.column(11).footer()).html(totalGeneralTTC);
        $(api.column(12).footer()).html(totalGeneralRestant);
    },
I'm wondering if it will be easier to create columns with the « green value » and the « red value » and hide them.
Then counting in the footerCallback the totals for these columns.
At last, show the values where I want (still don't know how...)
Also, should I declare global variables before the table so I can put them in the HTML header of the table ?
var totalAll = '';
var totalRed = '';
var nbRed = '';
var totalGreen= '';
var nbGreen = '';
<table id="demo" class="row-border hover order-column" width="100%">
    <thead>
        <tr>
            <th colspan="3"></th>
            <th colspan="10" class="txt-right">TOTAL En-cours : xxx € - <span class="indianred">Echues : xxx € (xx factures)</span> - <span class="olivedrab">Non échues : xxx € (xx factures)</span></th>
        </tr>
        <tr>
            <th class="control details"></th>
            <th class="reglement"></th>
            <th class="acquitter"></th>
            <th class="smallcaps dimgrey nowrap">mouvement</th>
            <th class="smallcaps dimgrey nowrap">stade</th>
            <th class="smallcaps dimgrey nowrap">type d'intervention</th>
            <th class="smallcaps dimgrey">numéro</th>
            <th class="smallcaps dimgrey">date</th>
            <th class="smallcaps dimgrey">client</th>
            <th class="smallcaps dimgrey">commettant</th>
            <th class="smallcaps dimgrey">échéance</th>
            <th class="smallcaps dimgrey nowrap">montant ttc</th>
            <th class="smallcaps dimgrey nowrap">restant dû</th>
            <th class="filtre">année</th>
            <th class="filtre">mois</th>
            <th class="filtre">nom mois</th>
            <!-- colonnes bidon pour forcer l'affichage de la colonne avec l'icône responsive -->
            <th class="none"></th>
            <th class="none"></th>
            <th class="none"></th>
            <th class="none"></th>
            <th class="none"></th>
            <th class="none"></th>
            <th class="none"></th>
            <th class="none"></th>
            <th class="none"></th>
            <th class="none"></th>
        </tr>
    </thead>
    <tfoot>
        <tr class="total bgcolor-light-<!--#4DHTML WEB_vt_interface -->">
            <td class="nowrap" colspan="11"></td>
            <td class="nowrap"></td>
            <td class="nowrap"></td>
            <td class="filtre"></td>
            <td class="filtre"></td>
            <td class="filtre"></td>
            <!-- colonnes bidon pour forcer l'affichage de la colonne avec l'icône responsive -->
            <td class="none"></td>
            <td class="none"></td>
            <td class="none"></td>
            <td class="none"></td>
            <td class="none"></td>
            <td class="none"></td>
            <td class="none"></td>
            <td class="none"></td>
            <td class="none"></td>
            <td class="none"></td>
        </tr>
    </tfoot>
</table>
As experienced users of datatable, what approach should I use ?
I will continue to search on the subject but if one direction is better than the other, let me know ![]()
Let me know if you want to see a test case, I didn't create it yet because I need to change the data for confidentiality reasons.
Thank you
Replies
is getting the data for the current page. It sounds like you need to filter that down. The
filter()method can be useful for that, but you only have the data for the column 11.What I think you'll need to is use
rows().data()- e.g:Allan
I don't understand your first sentence because totalGeneralTTC (column11) and totalGeneralRestant (column 12) are correctly updated when I'm doing search or applying a filter via search panes.
In the second part of your answer, what you suggest is for adding conditions based on the due date like I want ?
I will try to create a test case today, maybe it will be easier for me to explain what I want to achieve.
Yes, maybe I've misunderstood. An example is always welcome.
I thought your wanted what you have, just filtered to only some rows matching a given condition.
Allan
Hi,
I'm back with a test case, it's a work in progress, so you will see what I can't achieve yet but I think it will be helpful to explain.
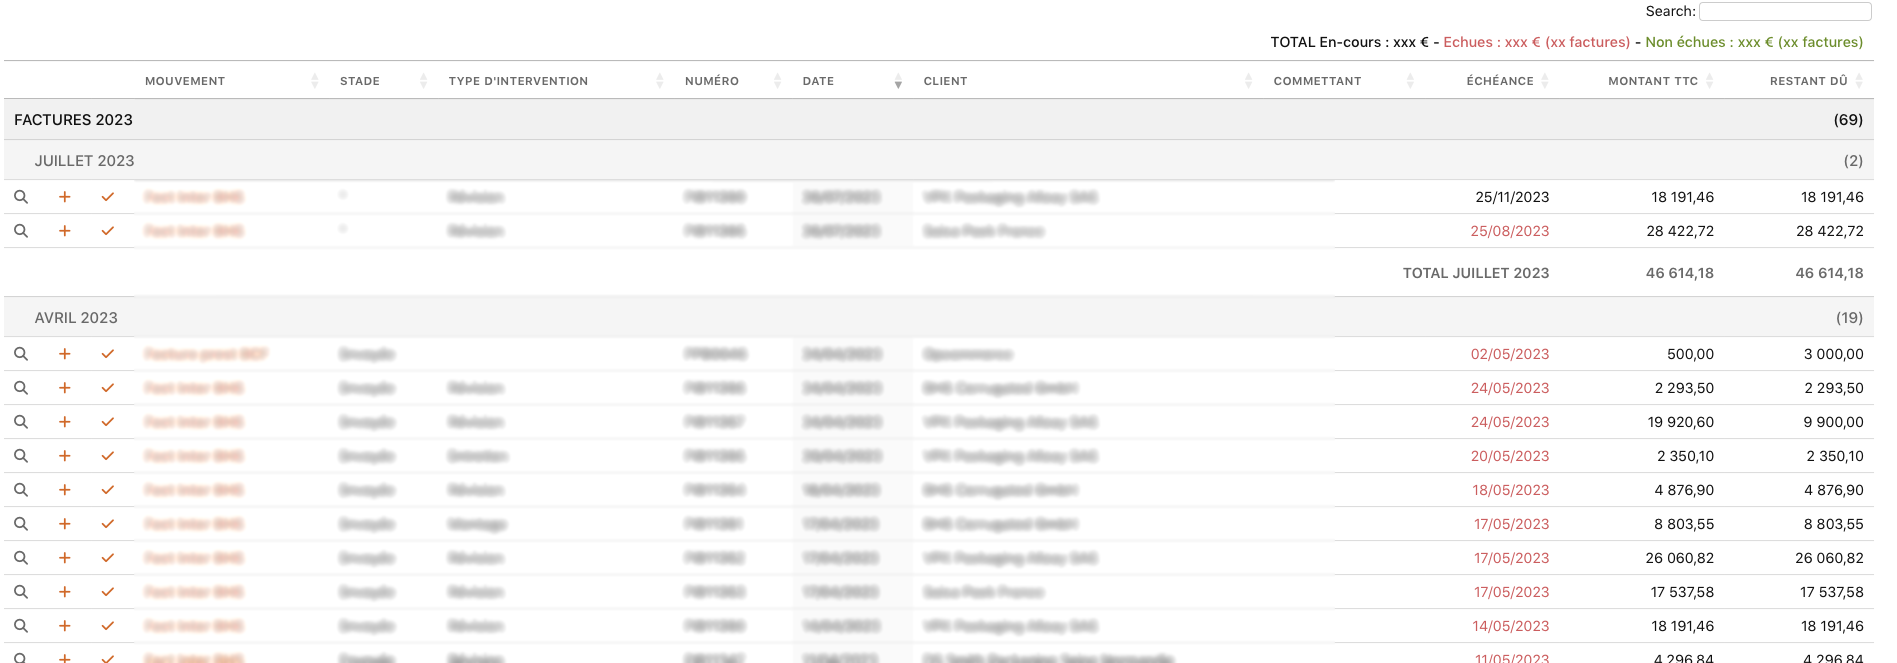
First, here a screenshot of the original website, what I want to create is the overview of the invoices at the beginning of the table with :
- total of invoices (en-cours)
- total of invoice unpaid, past due date + number (échues)
- total of invoice unpaid, but not late + number (non échues)
Each total should be updated when a search of a filter is done/selected.
My idea to reproduce this table was to create additional columns to be able to count the invoices and calculate the totals. The columns are in the test case but I couldn't achieve the sums + counts. I don't know why I can't use le column number when the data name is already used by another column. So I have no results (NAN). I've tried different ways, failed every time.
For now, I don't need theses additional columns. So if its the way to make the totals, the columns will be hidden to the final users.
And when I will have the totals and number of invoices for each, I don't know how to add before the table or in the table header.
Here is the test case full screen :
https://live.datatables.net/dagusipa/2
And the editable test case :
https://live.datatables.net/dagusipa/2/edit
I hope the test case will help to explain what I want to do.
Thank you
Sorry I'm still not totally clear on your data structure. To place the totals at the top I would consider using
drawCallbackand in the function userows().every()to loop all the rows. In the loop get the three totals you want. I took a guess and usedMontant2for the invoices total and placed pseudo code for evaluating if the unpaid invoice is past due or not for those totals.I updated the
divin HTML with a newspanto display theMontant2total. This is updated at the end ofdrawCallback. For example:The only way to get data from
columns.rendercells is to usecell().render()orcells().render(). Therow-selector(the first parameter) is a function selecting the rows that match the group. For example (only did this for level 0):The cell data looks like this
18191.46<br> compteur : 282. I'm not sure what value you want so I parsed the cell to get the first number.You can find both updates in this example:
https://live.datatables.net/dagusipa/3/edit
If this doesn't help then please specify exactly what data you want for each total.
Kevin
Hi Kevin,
I'm trying a visual explanation for the informations I want to calculate.
I should have delete my tests to obtain the results, It's confusing. Sorry.
I need 5 differents results (depending also on the filtered table).
The first one is easy to obtain, but I didn't find how to creates the 4 others.
Does this image explains better what I want to do ?
I try to do the calculation in the footerCallback to explain the needs but I know I should do it another way to use it at the beginning of the table.
Does it change your previous answer with these informations ?
You need to use the
filter()method I mentioned before. With that you reduce the data set to just the parts you want and then sum that. For example:Allan
Hi Allan,
I've tried your way, I just broke the table everytime, losing row grouping and 0 as a result for overDue.
Hi Kevin,
You example is working great !
I was full of hope, so I've clean the content of the column 13 and changed this line :
return a + (isNaN(b) ? b.split('<br>')[0] : b) * 1;to
return a + b * 1;And I broke it, the result is now NaN :
https://live.datatables.net/dagusipa/4/edit
I don't know why it's so complicated to do the sum for the columns 13, 14, 15 and 16 (except I'm bad at it !)
I added a console.log to the reduce function and see there are two numbers, for example:
-10 807.02. This is why you are getting NaN. You need to supply just one number. Updated example:https://live.datatables.net/rucufaci/1/edit
Kevin
Thanks for the feedback Kevin, there is a space because I was using this data rendering in the return :
return DataTable.render.number(' ', null, 2, null, '').display(row['Montant3']);if I put, I think it's working
return row['Montant3'];I will try to finish it and post a final (working !) test case.
This is the return of the test case")
It's almost done.
First, I gave another try to Allan suggestions and understood my errors and why it didn't work the first time.
So I've used it for the footerCallback and combine it with the drawCallback proposed by Kevin to update the table header.
This works great, the sums and count are updated when I'm using the search or filters.
You made a great cocktail !
Knowing the final user (I hate accountants, don't tell them...), I'm pretty sure he's gonna want me to show the totals and sub totals inside the table. And my project of hiding the last 4 columns could be dead.
When I'm inside the table grouping totals, there are errors in the results :
- the filters/search doesn't apply
- and for the Level 1 grouping (month), the results are wrong. I know that I must change something, probably this line but I don't know what (maybe because this syntax in not still clear for me)
Also, I don't know if it's my browser or not, but the search and filters are now slow.
In the orignal dataset I have more data in the columns and more filters in search panes, but I can't show it here.
Here's the test case updated :
https://live.datatables.net/rucufaci/2/edit
You probably need to add
{search: 'applied'}as the third parameter (selector-modifier) of thecells()API. For example:Sorry, I don't know as I'm not familiar with your data and what should be displayed at level 1. I would use the browser's debugger with a break point in the reduce function to see what is happening.
I'm not sure if this has anything to do with the issue but the
rowGroup.dataSrclooks like this:The primary ordering is set like this:
You have these column definitiions:
I'm not sure of the difference between
dateFacture.moisanddateFacture.nomMoisbut[18, 'desc']isdateFacture.moisinstead ofdateFacture.nomMois. This could account for the wrong results.`
There are a lot of loops performing totals. I would start by temporarily removing/commenting out some of the total loops to see if one or more are causing the delays.
Kevin
Hi Kevin,
I will try your recommandations tomorrow, I'm too tired tonight.
To answer your question about the data, it was a « shortcut » I used to sort the data like the accountant want it.
Facture.annee = year of the invoice
Facture.mois = month (numeric) of the invoice
Facture.nomMois = month (name) of the invoice
The sort wanted are :
- year, desc
- month (number), desc
The infos wanted to show in the row group are :
- year = level 0
- name of the month + year = Level 1
Example :
- 2022
- - December 2022 (sort on 12)
- - November 2022 (sort on 11)
- - etc
- - April 2022 (sort on 4)
- 2021
- - etc
It didn't want to write the months list inside the JS with 12 cases, I thought it was too long (and a bit silly maybe).
My « method » didn't cause wrong result for the columns 11 (montant TTC) and 12 (restant dû), that's why it was not the guilty one in my mind.
I'm sure a JS pro will do it differently.
I've changed the row grouping on the month, so I use the number of the month, like in the sort. But I still have the same errors on totals.
If you look at the results in the test case :
https://live.datatables.net/rucufaci/2/edit
You have
- 28422 for July 2023
- 499209 for July 2022
- and when the sub total monthly is calculated, the resutl is 527632 for July 2022 and July 2023 (499209 + 28422)
I've changed this :
for that, and now the results looks good :
I have questions related to the functions used to achieved this calculations.
I like the version suggested by Allan for te footerCallback, the code looks more « compact » and clear for me.
Is it a more performant way to do it ?
Why can't I use the same syntax inside the row group ?
I still need to find why the search and filters are slowing the page.")
I'll be back
You can. The start and end rendering functions are passed in an API instance with the rows in the group already populated. Eg
rows.data().filter....Allan
Good find. I didn't consider that the 2nd level groups would have the same names.
Kevin
It was logical when I watch closely the content of the table and easy to resolve, proud of this little find.
I also find the source of the slow refresh of the table, it's when I activate cascadePanes.
I tried to comment all the loops, the rowgroups, etc... it was still slow when I was using the search of search panes. I put everything back, comment the line about the cascading filters and bingo !
Maybe, it's normal and will be better on other computers, I'll see in a real user context if it's a problem or not for the users.
Thanks Allan, I will try this asap.