Dynamic Multi-Grouping

Dynamic Multi-Grouping

TyagiTyagi Posts: 11Questions: 3Answers: 0

Hi dear,
I am new in datatable.I am stuck befor 5 days for creating this example dynamic.
https://datatables.net/extensions/rowgroup/examples/initialisation/multipleGroups.html

I have 3 table scheme,subscheme,activity in sql server and i want showing data like above example .
Could you please help me ?
thanks.

This question has an accepted answers - jump to answer

Answers

  • colincolin Posts: 15,112Questions: 1Answers: 2,583
    Answer ✓

    Hi @Tyagi ,

    We're happy to take a look, but as per the forum rules, please link to a test case - a test case that replicates the issue will ensure you'll get a quick and accurate response. Information on how to create a test case (if you aren't able to link to the page you are working on) is available here.

    Cheers,

    Colin

  • TyagiTyagi Posts: 11Questions: 3Answers: 0

    Thanks

  • TyagiTyagi Posts: 11Questions: 3Answers: 0
    edited November 2019

    Hi @colin ,

    My need like this

    https://datatables.net/extensions/rowgroup/examples/initialisation/multipleGroups.html

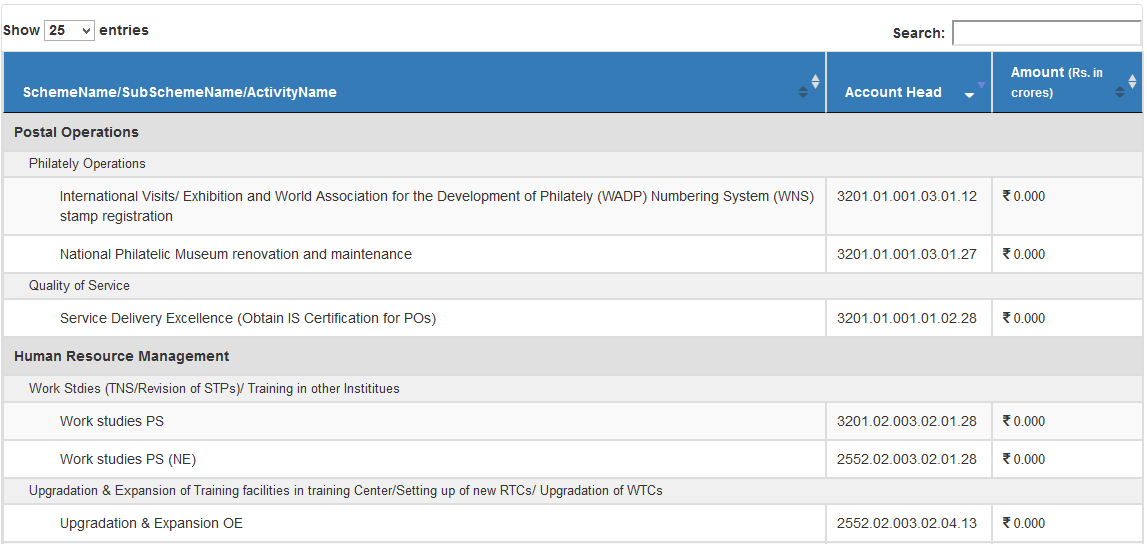
    first shows the Scheme name

    after SubScheme Name
    and after Amount.

    Here is my code.

            <table id="example" class="table table-striped table-bordered" style="width:100%">
                            <thead>
                                <tr>
                                  ![](https://datatables.net/forums/uploads/editor/i3/c96i6635gunx.png "")
    
                                    @*<th>Sub-Schem </th>*@
                                    <th>Activity</th>
                                    <th>Account Head </th>
                                    <th>Schem </th>
                                    <th>Amount <span style="font-size:12px;"> (Rs. in crores)</span></th>
                                </tr>
                            </thead>
                        </table>
    
     function BindDataTable() {
            var table = $("#example").DataTable({
              
                "processing": true, // for show progress bar
                "serverSide": true, // for process server side
                "filter": true, // this is for disable filter (search box)
                "orderMulti": false, // for disable multiple column at once
                "destroy": true,
               
                "lengthMenu": [[25, 100, -1], [25, 100, "All"]],
                "pageLength": 25,


                "order": [[2, 'desc']],
                "rowsGroup": [2],
                "ajax": {
                    "url": "/CP_Fund_Rpt/LoadCPActivityFund",
                    "data": {
                        FinYear: $('#FinYear').val(),
                        ScID: $('#SchemeName').val(),
                        ScSbID: $('#SubSchemeName').val()
                    },
                    "type": "POST",
                    "datatype": "json"
                },
    
    
                "columns": [
                     
    
      //{ "data": "SubScheme", "name": "SubScheme" },
                      { "data": "ActivityName", "name": "ActivityName" },
                        { "data": "AccountHead", "name": "AccountHead" },
                         {
                             "data": "SchemeName", "name": "SchemeName",
                             "rowGroup": {
                                 dataSrc: 'SchemeName',
                                 startRender: null,
                                 endRender: function (rows, group) {
    
                                     var salaryAvg = rows
                                         .data()
                                         .reduce(function (a, b) {
                                             return a + b.ActivityFund.replace(/[^\d]/g, '') * 1;
                                         }, 0) / rows.count();
    
                                     salaryAvg = $.fn.dataTable.render.number(',', '.', 0, '$').display(salaryAvg);
    
    
                                     //var ageAvg = rows
                                     //    .data()
                                     //    .reduce(function (a, b) {
                                     //        return a + b.extn * 1;
                                     //    }, 0) / rows.count();
    
                                     return $('<tr/>')
                                         .append('<td colspan="2">Averages for ' + group + '</td>')
                                         //.append('<td>' + ageAvg.toFixed(0) + '</td>')
                                         .append('<td/>')
                                         .append('<td>' + salaryAvg + '</td>');
                                 },
    
                             },
                         },
                        {
                            "data": "ActivityFund", "name": "ActivityFund",
                            render: function (data, type, row) {
                                if (type === 'display') {
                                    var numberRenderer = $.fn.dataTable.render.number(',', '.', 3, '<i class="fa fa-inr"/>  ').display;
                                    return numberRenderer(data); 
                                }
                                return data;
                            }
                        },
    
                 
                ],
               
            });
    
        }


    Edited by Colin - Syntax highlighting. Details on how to highlight code using markdown can be found in this guide.

  • colincolin Posts: 15,112Questions: 1Answers: 2,583

    It looks like you're using RowsGroup - this is a third-party extension. Note our RowGroup is enabled with rowGroup - see the example in the page you point to.

    Cheers,

    Colin

  • TyagiTyagi Posts: 11Questions: 3Answers: 0

    Hi @colin,
    Thanks too much i got that i want.

    I want to show total scheme amount also when one scheme ended.

    thanks.

  • TyagiTyagi Posts: 11Questions: 3Answers: 0

    Hi @colin ,
    i am doing using this code.
    "drawCallback": function (settings) {
    var api = this.api();
    var rows = api.rows({ page: 'current' }).nodes();
    var last = null;
    var subTotal = new Array();
    var groupID = -1;
    var aData = new Array();
    var index = 0;

                api.column(2, { page: 'current' }).data().each(function (group, i) {
    
                    // console.log(group+">>>"+i);
    
                    var vals = api.row(api.row($(rows).eq(i)).index()).data();
                    var ActivityFund = vals[4] ? parseFloat(vals[4]) : 0;
    
                    if (typeof aData[group] == 'undefined') {
                        aData[group] = new Array();
                        aData[group].rows = [];
                        aData[group].ActivityFund = [];
                    }
    
                    aData[group].rows.push(i);
                    aData[group].ActivityFund.push(ActivityFund);
    
                });
    
    
                var idx = 0;
    
    
                for (var SchemeName in aData) {
    
                    idx = Math.max.apply(Math, aData[SchemeName].rows);
    
                    var sum = 0;
                    $.each(aData[SchemeName].ActivityFund, function (k, v) {
                        sum = sum + v;
                    });
                    console.log(aData[SchemeName].ActivityFund);
                    $(rows).eq(idx).after(
                         '<tr class="group"><td colspan="2"> Total Amount of   ' + SchemeName + '</td>' +
                         '<td>' +' <i class="fa fa-inr"/> &nbsp;'+ + sum + '</td></tr>'
                     );
    
                };
    
            }
    

    but my sum of total scheme is coming 0.

  • colincolin Posts: 15,112Questions: 1Answers: 2,583

    As I said above, please link to a test case, and we'll take a look.

This discussion has been closed.