Excel Export to create new sheet for server side data
Excel Export to create new sheet for server side data
 Khalid Teli
Posts: 251Questions: 71Answers: 0
Khalid Teli
Posts: 251Questions: 71Answers: 0
Hi @kthorngren
I was using you example here live.datatables.net/qinoxinu/6/edit for Excel Export to create new sheet.
While I was implementing the example on table with client side data and it works as expected.
However, when I used to include the table on new sheet where the data comes from server side, it shows invalid XML and the error looks like this:
Uncaught Error: Invalid XML: <?xml version="1.0" encoding="UTF-8" standalone="yes"?><worksheet xmlns="http://schemas.openxmlformats.org/spreadsheetml/2006/main" xmlns:r="http://schemas.openxmlformats.org/officeDocument/2006/relationships" xmlns:mc="http://schemas.openxmlformats.org/markup-compatibility/2006" xmlns:x14ac="http://schemas.microsoft.com/office/spreadsheetml/2009/9/ac" mc:Ignorable="x14ac"><cols><col min="1" max="1" width="20" customWidth="1"/><col min="2" max="2" width="20" customWidth="1"/><col min="3" max="3" width="20" customWidth="1"/><col min="4" max="4" width="20" customWidth="1"/><col min="5" max="5" width="20" customWidth="1"/><col min="6" max="6" width="20" customWidth="1"/><col min="7" max="7" width="20" customWidth="1"/><col min="8" max="8" width="20" customWidth="1"/><col min="9" max="9" width="20" customWidth="1"/><col min="10" max="10" width="20" customWidth="1"/><col min="11" max="11" width="20" customWidth="1"/><col min="12" max="12" width="20" customWidth="1"/><col min="13" max="13" width="20" customWidth="1"/><col min="14" max="14" width="20" customWidth="1"/><col min="15" max="15" width="20" customWidth="1"/><col min="16" max="16" width="20" customWidth="1"/><col min="17" max="17" width="20" customWidth="1"/><col min="18" max="18" width="20" customWidth="1"/><col min="19" max="19" width="20" customWidth="1"/><col min="20" max="20" width="20" customWidth="1"/></cols><sheetData><row r="1"><c t="inlineStr" r="A1" s="51"><is><t>My Sheet2</t></is></c></row><row r="2"><c t="inlineStr" r="A2" s="2"><is><t>Product<br> Code</t></is></c><c t="inlineStr" r="B2" s="2"><is><t>Contract Prod</t></is></c><c t="inlineStr" r="C2" s="2"><is><t>Product Name</t></is></c><c t="inlineStr" r="D2" s="2"><is><t>Pack Size</t></is></c><c t="inlineStr" r="E2" s="2"><is><t>Start Date</t></is></c><c t="inlineStr" r="F2" s="2"><is><t>End Date</t></is></c><c t="inlineStr" r="G2" s="2"><is><t>CF</t></is></c><c t="inlineStr" r="H2" s="2"><is><t>BF</t></is></c><c t="inlineStr" r="I2" s="2"><is><t>TP</t></is></c><c t="inlineStr" r="J2" s="2"><is><t>Bl<br> F</t></is></c><c t="inlineStr" r="K2" s="2"><is><t>CF</t></is></c><c t="inlineStr" r="L2" s="2"><is><t>DF</t></is></c><c t="inlineStr" r="M2" s="2"><is><t>EFF</t></is></c><c t="inlineStr" r="N2" s="2"><is><t>HF</t></is></c><c t="inlineStr" r="O2" s="2"><is><t>HF</t></is></c><c t="inlineStr" r="P2" s="2"><is><t>SF</t></is></c><c t="inlineStr" r="Q2" s="2"><is><t>TR</t></is></c><c t="inlineStr" r="R2" s="2"><is><t>TF</t></is></c><c t="inlineStr" r="S2" s="2"><is><t>SSWF</t></is></c><c t="inlineStr" r="T2" s="2"><is><t>Group Total</t></is></c></row><row r="3"></row><row r="4"></row><row r="5"></row></sheetData><mergeCells count="1"><mergeCell ref="A1:T1"/></mergeCells></worksheet>
    at Function.error (datatables.js:317)
    at Function.jQuery.parseXML (datatables.js:8416)
    at addSheet (crg_contracts_print.php:751)
    at Object.customize (crg_contracts_print.php:936)
    at _Api.action (datatables.js:106760)
    at action (datatables.js:102041)
    at HTMLButtonElement.<anonymous> (datatables.js:102058)
    at HTMLButtonElement.dispatch (datatables.js:5195)
    at HTMLButtonElement.elemData.handle (datatables.js:5003)
I believe the error is coming from this function where it is not merging the cells properly.
function getTableData(table, title) {
        var header = getHeaderNames(table);
        var table = $(table).DataTable();
        console.log(table);
        var rowNum = 1;
        var mergeCells = '';
        var ws = '';

        ws += buildCols(header);
        ws += '<sheetData>';

        if (title.length > 0) {
          ws += buildRow([title], rowNum, 51);
          rowNum++;

          mergeCol = ((header.length - 1) + 10).toString(36).toUpperCase();

          mergeCells = '<mergeCells count="1">'+
            '<mergeCell ref="A1:' + mergeCol + '1"/>' +
                       '</mergeCells>';
        }
How to go with the problem when you use server side data?
Please help
Thank you
This discussion has been closed.
Answers
Hi @kthorngren
Please ignore my previous comments. I managed to work it. As, I was using object data so I had to change it to Array data. Also I was using a break in html <br> which caused the error.
There are two issues I am facing:
1) The table header length is 20 however the actual length of row data from the table , length is 22. How can I control which data to show?
2) live.datatables.net/capuxixa/1/edit
As shown in the example above,
(#example2)when I use therowGroup, how can I get access to the variable where rowgroup data is saved and then display it inside the table?Thank you
Your help will be highly appreciated
Colin
Hi @colin
Sorry, If my question was not clear
live.datatables.net/vijabavi/1/edit
1)I am working on local host so I cant produce an example for case (1) , However I will explain in details
When I implement the above code in attached example (for exporting the Excel in new sheet)
My table has 20 headers and output of the getHeaderNames function gives the right output. The output of console.log(names) looks like this:
(20) ["PC", "CP", "PN", "PS", "SD", "ED", "CF", "BF", "TP", "BF", "CF", "DF", "EF", "HF", "HF", "SF", "TRF", "TF", "SSW", "GT"]Again, using the below code from example , to loop over table data , the output of console.log(data) gives me, which is two columns extra. (first two, they are there in database but not included in table)
(22) ["row_7243723", 7243723, 31010615, "CM", "CW 70:30", "6 x 2kg", "2020-07-01", "2020-09-30", 545, 150, 0, 0, 90, 0, 0, 0, 0, 0, 480, 0, 200, 1465]The client side code to read the data looks like this:
My Issue is , if I have only 20 columns defined on client side to read data from server side , why does it return 22 columns data?
Apart from this it works fine
2) live.datatables.net/vijabavi/1/edit
I you have a look at this example, when you click on excel button, it exports the table data (#example) on Excel sheet and the data from other table (#example2) on new sheet in the same file.
However, when I am using RowGroup to group the data by column (office, shown in red).
How can I include this data and export this with the table data in the newsheet created?
Thank you
Kind Regards,
Khalid Teli
Thanks for the explanations.
That'll be down to your server-side script - that's sending the data to the client. The server can send anything it likes to the client, but DataTables will only use the fields that have been configured in the
columnsobject.Yep, RowGroup doesn't export the headers/footers automatically. There are a few threads discussing this that may help - see here and here.
Colin
@colin
Thank you the problem 1 is solved.
2) For issue no. 2, I used the example and includes the row which includes the rowGroup information as hown in the figure:
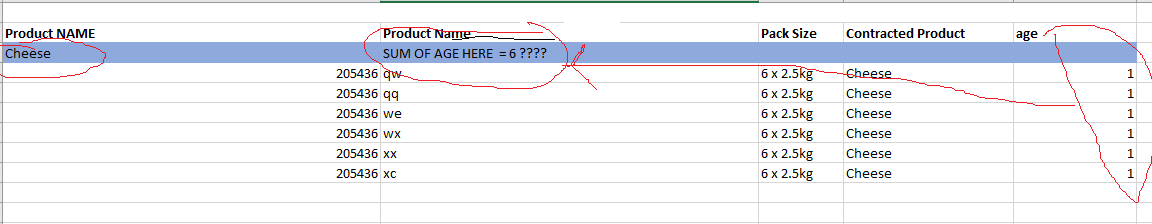
As you can see in the figure it groups the table by contracted products (cheese) and displays it on exported excel sheet.
What I am trying to do is sum the age for that group and export it in excel file as well .
For that I edited the code below:
https://datatables.net/forums/discussion/comment/172979#Comment_172979
I used the example and it works fine. I tried to include one more column
var new_index = config.new_index;where new_index is the age column from the table.For each rowGroup I want to add the age and display in $column_index===1
I got the age from the age column and then pushed inside an array, like this:
eventually I want to add it using
and then display it using
table_data[$column_index] = sum_ages;
I am able to get the data add it and return the sum.
Right now what it is doing, it is taking all the values from the column irrespective of the rowGroup. I need to put in some logic where it will only sum the column values for a particular row group.
In some way I need to restrict the sum to only rowGroup not the all table data
Can you please give me any suggestions
Your help will be highly appreciated.
Thank you
We do plan on supporting that feature fairly soon, it's on our upcoming projects, and then it'll be officially supported. If you want to update your test case to show this code and what you've got, we or other forum member could possibly take a look and see if there's a quick fix.
Colin
@colin
That is amazing news, cant wait for that to be a feature soon.
In terms of the current issue, as I said I am editing the export code in
datables.jsfile. I am not sure how can I take that function and use in client side code, so I can provide a test case. I have been trying all day but no luck.I just replaced the
var _exportDatafunction with the one below :I understand it is much easy if I provide a test case. if you can just give me an idea how can I use this function inside client side code , so it will be easy for me to provide a test case.
Thank you
This example here should help, as it shows how
exportDatacan be over-written - this is for getting server-side data to export, but the principle would be the same for you too,Colin
@collin Thank you very much for your help.
I guess I have reached to a point where I can provide a test case.
live.datatables.net/xagasone/1/edit
1) if you see in the code provided in the link, inside
exportoptionsI have included the code:a) the output of
console.log(table_data); is ["Tokyo", "123", "", "", "", ""],which I added to the table body and can be seen at the end of body data which is confirmed byconsole.log(data.body);But when I export , this row doesn't get exported the excel file.b) Once this is sorted, I can then show you the code I wrote for include the average age for a row group to be included for each group , some thing like this : ["Tokyo", "123", "append the average age here for each group ", "", "", ""],
Thank you
@collin
Please see this link as previous one is not working as expected
live.datatables.net/kowofuwu/1/
1) This is the output of rowGroups (group by column 2)
"Edinburgh"
"London"
"New York"
"San Francisco"
"Tokyo"
2) This is body output which includes the above data as rows:
[["Edinburgh", "123", "", "", "", ""], ["Tiger Nixon", "System Architect", "Edinburgh", "61", "2011/04/25", "$320,800"], ["Cedric Kelly", "Senior Javascript Developer", "Edinburgh", "22", "2012/03/29", "$433,060"], ["Sonya Frost", "Software Engineer", "Edinburgh", "23", "2008/12/13", "$103,600"], ["Quinn Flynn", "Support Lead", "Edinburgh", "22", "2013/03/03", "$342,000"],["London", "123", "", "", "", ""], ["Jena Gaines", "Office Manager", "London", "30", "2008/12/19", "$90,560"], ["Haley Kennedy", "Senior Marketing Designer", "London", "43", "2012/12/18", "$313,500"], ["Tatyana Fitzpatrick", "Regional Director", "London", "19", "2010/03/17", "$385,750"], ["Michael Silva", "Marketing Designer", "London", "66", "2012/11/27", "$198,500"], ["New York", "123", "", "", "", ""], ["Brielle Williamson", "Integration Specialist", "New York", "61", "2012/12/02", "$372,000"], ["Paul Byrd", "Chief Financial Officer (CFO)", "New York", "64", "2010/06/09", "$725,000"], ["Gloria Little", "Systems Administrator", "New York", "59", "2009/04/10", "$237,500"], ["San Francisco", "123", "", "", "", ""], ["Ashton Cox", "Junior Technical Author", "San Francisco", "66", "2009/01/12", "$86,000"], ["Herrod Chandler", "Sales Assistant", "San Francisco", "59", "2012/08/06", "$137,500"], ["Colleen Hurst", "Javascript Developer", "San Francisco", "39", "2009/09/15", "$205,500"], ["Charde Marshall", "Regional Director", "San Francisco", "36", "2008/10/16", "$470,600"], ["Tokyo", "123", "", "", "", ""], ["Garrett Winters", "Accountant", "Tokyo", "63", "2011/07/25", "$170,750"], ["Airi Satou", "Accountant", "Tokyo", "33", "2008/11/28", "$162,700"], ["Rhona Davidson", "Integration Specialist", "Tokyo", "55", "2010/10/14", "$327,900"]],
These rows in bold doesn't get exported
Thank you
I'm unlikely to have time to look at that, I'm afraid, but this thread here is worth looking at to compare your code against - they appear to have got it working,
Colin
@colin
Thank you very much. This thread helped me.
I managed to export the rowGrop information with other calculations specific to the rowgroup and export these calculations with the rowgroup info.
In case someone needs it, I am attaching the example below.
This example prints the additional row with the rowgroup information and also, sums the age of employees for that particular group and exports that sum age info too.
live.datatables.net/raseguji/1/edit
Thank you
Very nice, I'm glad you were able to get it going, and thanks for sharing that excellent solution,
Colin