problem with OrderFixed on a complex DT (row group, responsive, etc)

problem with OrderFixed on a complex DT (row group, responsive, etc)

MelodyNelsonMelodyNelson Posts: 126Questions: 21Answers: 2

Link to test case: https://live.datatables.net/xoqasoga/16/edit
Debugger code (debug.datatables.net):
Error messages shown:
Description of problem:

Hi,

I Have 3 problems/questions on a DT 2.0 with rowgroup (responsive and other extensions)

1) Problem width OrderFixed

I've created a test case with (almost) real data, but the output doesn't work and I don't find the reason why.
So I've put screenshot to try to explain.
At least, you can see the JS content here :
https://live.datatables.net/xoqasoga/16/edit

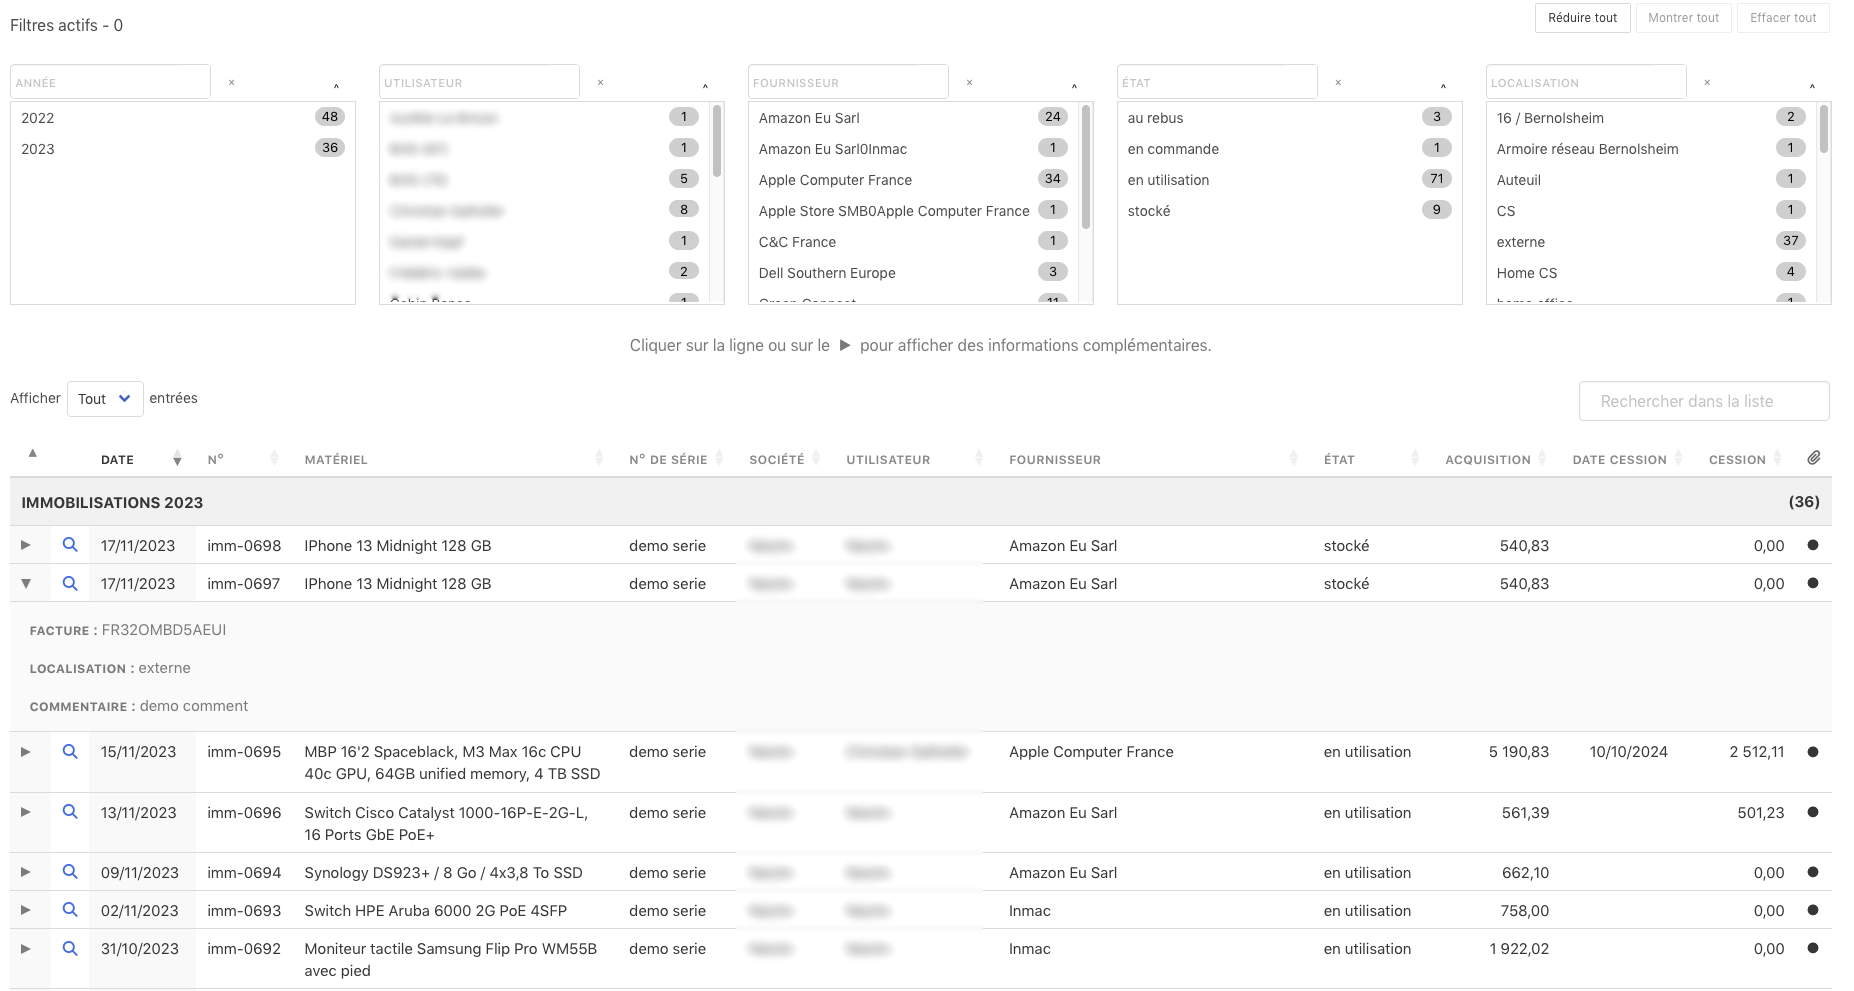
If I add a fixed order on the column Date with orderFixed: [2, 'desc'].

This is how the table look like :
- the fixed order is good
- a triangle is showing at the top of the column 0 (it doesn't happen with an order « not fixed » order: [2, 'desc'])
- sorting the other columns doesn't work anymore (it doesn't happen with an order « not fixed » order: [2, 'desc'])

This is part of the DT code :

        orderFixed: [2, 'desc'], // tri fixe pour la rupture (dateDebut)
        responsive: {
            details: {
                type: 'column',
                target: 'tr',
                renderer: function (api, rowIdx, columns) {
                    var data = $.map(columns, function (col, i) {
                        return col.hidden
                            ? '<p class="has-text-grey px-2 py-2"><span class="has-text-weight-semibold smallcaps">'+ col.title + ' : </span>' + col.data + '</p>'
                            : '';
                        }).join('');
                    return data ;
                }
            }
        },
        rowGroup: {
            dataSrc: 'dateDebut.annee', // groupe pour rupture
            startClassName: 'rupture has-text-' + interfaceBB, 
            endClassName: 'soustotal has-text-' + interfaceBB, 
            startRender: function ( rows, group ) {
                return 'IMMOBILISATIONS ' + group + '<span class="is-pulled-right">('+rows.count()+')</span>';
            },
            endRender: function (rows, group) {
                
                // sous-totaux par groupe 
                
                var subtotalAchat =
                    rows
                        .data()
                        .pluck('Montant1')
                        .reduce(function (a, b) {
                            return a + b * 1;
                        }, 0) ;

                var subtotalCession =
                    rows
                        .data()
                        .pluck('Montant2')
                        .reduce(function (a, b) {
                            return a + b * 1;
                        }, 0) ;

                subtotalAchat = DataTable.render.number(' ', ',', 2, null, '').display(subtotalAchat);
                subtotalCession = DataTable.render.number(' ', ',', 2, null, '').display(subtotalCession);

                return $('<tr/>')
                .append('<td colspan="10" class="has-text-right has-text-weight-semibold">TOTAL ' + group + ' (' + rows.count() + ')</td>')
                .append('<td class="has-text-right has-text-weight-semibold">' + subtotalAchat + '</td>')
                .append('<td></td>')
                .append('<td class="has-text-right has-text-weight-semibold">' + subtotalCession + '</td>')
                .append('<td></td>');
            }
        }

2) Rowgroup & Responsive : How counting the <td> ?

In the same DT, with RowGroup I'm adding subtotals for each group, and a global total as you can see on the capture below.

But the DT is responsive and I don't know how I could count the visible <td> to add the good value in the colspan in the subtotal in the endRenderof rowgroup.

I don't have the problem with the footerCallbackfor the global total because the JS code is different.

Here, the subtotals have the right value in colspan because all columns are visible :

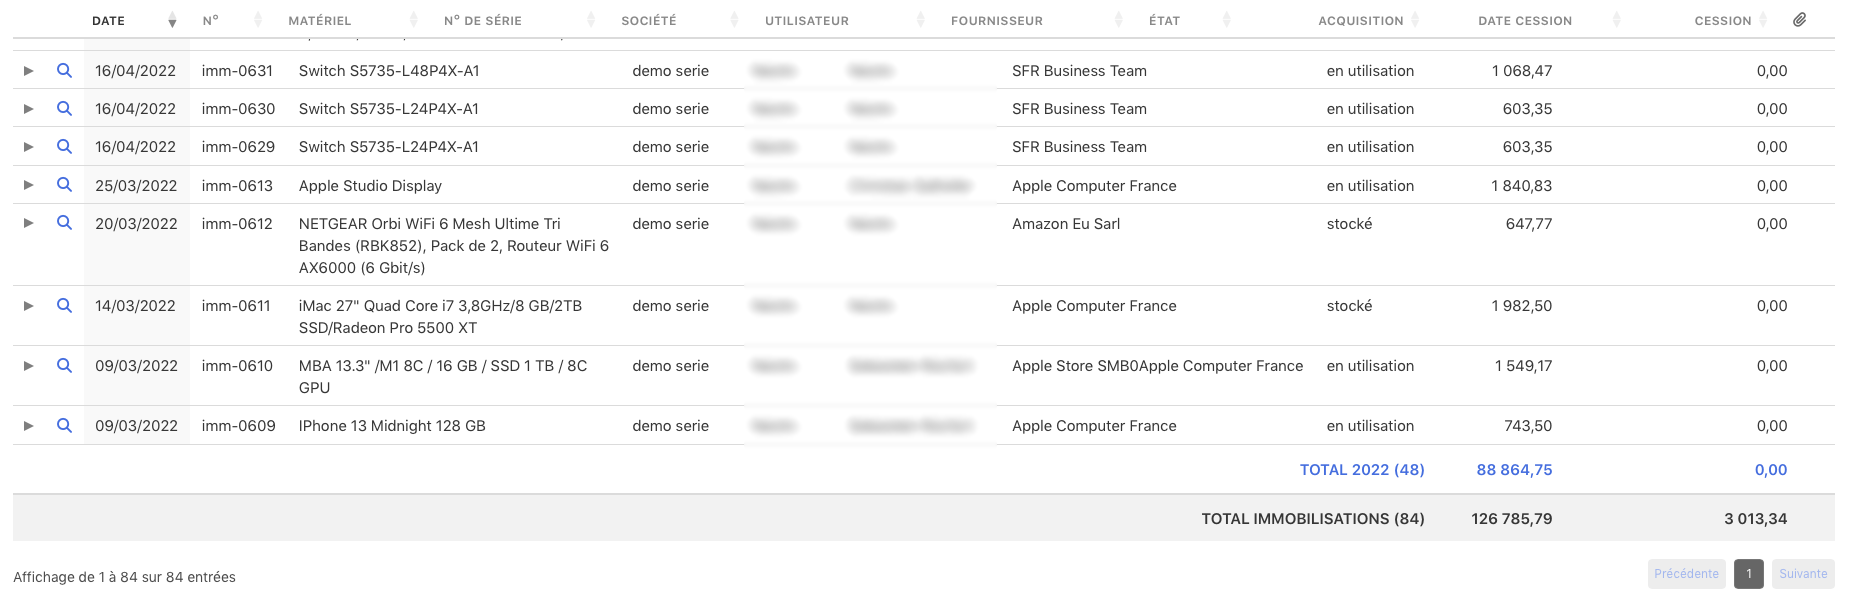
Here, the window is smaller, some columns on the right are hidden and the subtotals <tr> doesn't look good (because of my code !) To be perfect, I should change the colspan and also hide the same columns) :

3) FixedHeader, alignement problems

As you can see on the last 2 screenshots, the title columns in the fixed header doesn't have the same width of the content <td>.
I thought this problem was solved in DT 2.0.
Maybe, I should change something in my JS or HTML code ?

Thank you for your patience reading this long message (full of typos) and your help

Replies

  • MelodyNelsonMelodyNelson Posts: 126Questions: 21Answers: 2

    Hi,

    I have made a new test case with the default data for the sorting problem :
    - with order, sorting on a hidden column number 16, DT sorts an col 1 and col 6
    - with orderFixed, it doesn't sort

    https://live.datatables.net/fubapilu/1/edit

  • kthorngrenkthorngren Posts: 20,381Questions: 26Answers: 4,781

    Problem width OrderFixed

    The ordering issue was fixed in Datatables 2.0.3. See the Release notes.

    Rowgroup & Responsive : How counting the <td> ?

    One option is to use columns().responsiveHidden() to get a boolean array of columns visible using Responsive. Likely will want to use responsive-resize to redraw the table using draw() with the page parameter to keep the column visible count updated.

    FixedHeader, alignement problems

    Possibly due to the use of RowGroup as discussed in this thread.

    Updated test case with 2.0.3 and columns().responsiveHidden() example:
    https://live.datatables.net/fubapilu/2/edit

    Kevin

  • MelodyNelsonMelodyNelson Posts: 126Questions: 21Answers: 2

    Hi Kevin,

    Thanks a lot for your answers and test case.

    Where is the link to the Release notes on the website so I can stay updated about new versions ?

    I tried to create the colspan I need based on your example but I don't know if I did it well.
    At first I put responsive priority to some columns, including the ones at the end who will have values to count at the end of the rowgroup in « real life » (I add some pink to the columns to highlight them).

    Here's a test case based on yours : what do your think of it ?
    https://live.datatables.net/fubapilu/4/edit

  • kthorngrenkthorngren Posts: 20,381Questions: 26Answers: 4,781
    edited April 12

    Where is the link to the Release notes on the website so I can stay updated about new versions ?

    Here is the link. You can navigate to it by clicking Download on the left side of the page then clicking DataTables CDN in the first paragraph.

    Here's a test case based on yours : what do your think of it ?

    Looks like it works. I updated to get the number of hidden columns from the columns().responsiveHidden() result.
    https://live.datatables.net/zetumoki/1/edit

    Also you may need to make sure the number of columns visible is greater than 3 otherwise the colspan calculation will cause more RowGroup cells than what is displayed in the table.

    Kevin

  • MelodyNelsonMelodyNelson Posts: 126Questions: 21Answers: 2

    Thanks again Kevin.

    The link is in my bookmarks now.

    I've tested the new code for the « colspan » and the visibles columns, it works but... it's slowing the DT. And my browser seems slow too and I still need to reload the page after resizing the window (maybe too old browser... and too much data in the table).

    I will see if it works better in the real user conditions.

    I wish we could do it like in the footer callback because it works very well with this code (for my table) and the colspan is automatic :

    footerCallback: function (row, data, start, end, display) {
                var api = this.api();
                var pageInfo = api.page.info();
            
                // totaux (après filtres éventuels)
                totalAchat = api
                    .column(10, { page: 'current' })
                    .data()
                    .reduce(function (a, b) {
                        return a + b * 1;
                    }, 0);
    
                totalCession = api
                    .column(12, { page: 'current' })
                    .data()
                    .reduce(function (a, b) {
                        return a + b * 1;
                    }, 0);
    
                // number formatter : DataTable.render.number(thousands, decimal, precision, prefix, postfix)
                totalAchat = DataTable.render.number(' ', ',', 2, null, '').display(totalAchat);
                totalCession = DataTable.render.number(' ', ',', 2, null, '').display(totalCession);
    
                var labelTotal = 'TOTAL IMMOBILISATIONS (' + pageInfo.recordsDisplay + ')';
    
                // update footer
                $(api.column(1).footer()).html(labelTotal);
                $(api.column(10).footer()).html(totalAchat);
                $(api.column(12).footer()).html(totalCession);
            }
    
  • kthorngrenkthorngren Posts: 20,381Questions: 26Answers: 4,781

    I've tested the new code for the « colspan » and the visibles columns, it works but... it's slowing the DT.

    I suspect the problem is with the responsive-resize event and calling draw(). It could be called many times in a short period when resizing a page. You can try creating a debounce function to stop the draw from happening until the user stops resizing the page. For example:
    https://live.datatables.net/zetumoki/2/edit

    Note that it uses the underscore.js library. This is added to the HTML tab:

        <script src="https://cdnjs.cloudflare.com/ajax/libs/underscore.js/1.13.2/underscore-min.js"></script>
    

    I don't think the code added to rowGroup.endRender is slowing anything down.

    Kevin

  • MelodyNelsonMelodyNelson Posts: 126Questions: 21Answers: 2

    I think the same, I will have a look tonight at your suggestion.

    Also I'm wondering if I put the resize in the right place.
    This is the total JS of my table in case I should place it elsewhere, the resize is at the end.

    (sorry for the size of the code included in the post)

    <script>
    var interfaceBB = '$4DTEXT(WEB_vt_interface)';
    var dataSet = <!--#4DHTML WEB_vt_dataListeImmos -->;
    var contenuColonnes = [
        { data: null, defaultContent: '' }, // colonne 0, class dtr-control pour responsive 
        { data: 'Code_affaire',
            render: function ( data, type, row ) {
                return '<a rel="modal:open" href="AJAX/get/Affaire/' + data + '?tcom1=$4DTEXT(WEB_vt_interface)&template=affaire/details/modal/immobilisation"><i class="fa-solid fa-magnifying-glass" title="Consulter la fiche"></i></a>';
            }
        },
        { data: {
            _: 'dateDebut',
            display: 'dateDebut.display',
            sort: 'dateDebut.sort'
            }
        },
        { data: 'Code_affaire'},
        { data: 'Libelle_affaire'},
        { data: 'numSerie.libelle' },
        { data: 'societe.libelle' },
        { data: 'personne',
            render: function ( data, type, row ) {
                if (data.Pers_Physique == false) {              
                    if (data.Societe == 'BHS Corrugated France') {
                        var utilisateur = 'BHS (' + data.CP_Avant.substring(0, 2) + ')' ;
                    } else {
                        var utilisateur = data.Societe;
                    }               
                } else {
                    var utilisateur = data.Prenom + " " + data.Nom;
                }
            return utilisateur;
            }
         },
        { data: 'autresPersonnes[0].personne.Societe'},
        { data: 'etat.libelle' },
        { data: 'Montant1' },
        { data: 'dateFin', render: render_controle_date },
        { data: 'Montant2' },
        { data: 'compteurFichiers',
            render: function ( data, type, row ) {
                if (data > 0) {
                    var icone = '<i class="fa-solid fa-circle fa-xs has-text-dark"></i> ';
                } else {
                    var icone = '';
                }
            return icone;
            }
        },
        { data: 'facture.libelle' },
        { data: 'localisation.libelle' },
        { data: 'commentaireFormate'},
        { data: 'dateDebut.annee'}
    ];
    
    $(document).ready(function() {
    
    //  $('#liste_immos').DataTable( {
        
        var table = new DataTable('#liste_immos', {
            data: dataSet,
            columns: contenuColonnes,
            fixedHeader: true,
            pageLength: -1,
            layout: {
                top2: 'searchPanes',
                top1: function () {
                    let legende = document.createElement('div');
                    legende.innerHTML = '<p class="has-text-centered has-text-grey mb-3">Cliquer sur la ligne ou sur le <span class="mx-1">&#9654;</span> pour afficher des informations complémentaires.</p>';
                    return legende;
                }
            },
            searchPanes: {
                columns: [17, 6, 7, 8, 9, 15],
                cascadePanes: true
            },
            columnDefs: [
                { orderable: false, targets: [0, 1, 13] },
                { render: DataTable.render.number(' ', ',', 2, '' , ''), targets : [10, 12] }, // decimal
                { className: 'icone', targets: [0, 1, 13] },
                { className: 'dtr-control', targets: [0] },
                { className: 'white-space-nowrap', targets: [3, 6, 7, 8, 9] },
                { className: 'has-text-right', targets: [10, 12] },
                { className: 'has-text-centered', targets: [11] },
                { responsivePriority: 1, targets: [0, 1, 2, 3, 10, 11, 12, 13] },
            ],
            orderFixed: [[17, 'desc']], // tri fixe pour la rupture (dateDebut.annee)
            order: [[2, 'desc']], // tri par défaut dans chaque group (dateDebut)
            responsive: {
                details: {
                    type: 'column',
                    target: 'tr',
                    renderer: function (api, rowIdx, columns) {
                        var data = $.map(columns, function (col, i) {
                            return col.hidden
                                ? '<p class="has-text-grey px-2 py-2"><span class="has-text-weight-semibold smallcaps">'+ col.title + ' : </span>' + col.data + '</p>'
                                : '';
                            }).join('') ;
                        return data ;
                    }
                }
            },
            rowGroup: {
                dataSrc: 'dateDebut.annee', // groupe pour rupture
                startClassName: 'rupture has-text-' + interfaceBB, 
                endClassName: 'soustotal has-text-' + interfaceBB, 
                startRender: function ( rows, group ) {
                    return 'IMMOBILISATIONS ' + group + '<span class="is-pulled-right">('+rows.count()+')</span>';
                },
                endRender: function (rows, group) {
                    
                    // compter les colonnes visibles ou non (responsive)
                    var resposniveVisiblity = $('#liste_immos').DataTable().columns().responsiveHidden().toArray();
                    var numVisible = resposniveVisiblity.filter(x => x === true).length;
                    var numInvisible = resposniveVisiblity.filter(x => x === false).length;
                    // May need to perfom a check to make sure there are at least 4 columns visible otherwise colspan will be a negative number
                    var valueColspan = numVisible - 4; // les 4 colonnes à la fin qui doivent toujours être présentes (cf responsive priority)
                    
                //  var InfosCols = ' col visibles : ' + numVisible + ' / invisibles : ' + numInvisible;
                //  console.log(InfosCols);
                //  console.log('colspan : ' + valueColspan);
                                
                    // sous-totaux par groupe
                    var subtotalAchat =
                        rows
                            .data()
                            .pluck('Montant1')
                            .reduce(function (a, b) {
                                return a + b * 1;
                            }, 0) ;
    
                    var subtotalCession =
                        rows
                            .data()
                            .pluck('Montant2')
                            .reduce(function (a, b) {
                                return a + b * 1;
                            }, 0) ;
                    
                    subtotalAchat = DataTable.render.number(' ', ',', 2, null, '').display(subtotalAchat);
                    subtotalCession = DataTable.render.number(' ', ',', 2, null, '').display(subtotalCession);
    
                    return $('<tr/>')
                    .append('<td colspan="' + valueColspan + '" class="has-text-right has-text-weight-semibold white-space-nowrap">TOTAL ' + group + ' (' + rows.count() + ')</td>')
                    .append('<td class="has-text-right has-text-weight-semibold white-space-nowrap">' + subtotalAchat + '</td>')
                    .append('<td></td>')
                    .append('<td class="has-text-right has-text-weight-semibold white-space-nowrap">' + subtotalCession + '</td>')
                    .append('<td></td>');
                }
            },
            footerCallback: function (row, data, start, end, display) {
                var api = this.api();
                var pageInfo = api.page.info();
            
                // totaux (après filtres éventuels)
                totalAchat = api
                    .column(10, { page: 'current' })
                    .data()
                    .reduce(function (a, b) {
                        return a + b * 1;
                    }, 0);
    
                totalCession = api
                    .column(12, { page: 'current' })
                    .data()
                    .reduce(function (a, b) {
                        return a + b * 1;
                    }, 0);
    
                // number formatter : DataTable.render.number(thousands, decimal, precision, prefix, postfix)
                totalAchat = DataTable.render.number(' ', ',', 2, null, '').display(totalAchat);
                totalCession = DataTable.render.number(' ', ',', 2, null, '').display(totalCession);
    
                var labelTotal = 'TOTAL IMMOBILISATIONS (' + pageInfo.recordsDisplay + ')';
    
                // update footer
                $(api.column(1).footer()).html(labelTotal);
                $(api.column(10).footer()).html(totalAchat);
                $(api.column(12).footer()).html(totalCession);
            }
    
        });
        
        // recalcule le tableau quand on redimensionne (permet de mettre à jour le colspan des sous-totaux / groupe)
        table.on('responsive-resize', function () {
          table.draw('page');
        });
    
    // end document ready
     });
    </script>
    
  • MelodyNelsonMelodyNelson Posts: 126Questions: 21Answers: 2

    I think you're right, I will try tonight your suggestion.

    Just in case this is the totally of the code of my table, maybe I put the resize at the wrong place ?

    (sorry for all the following code in the post, it's very long...)

    <script>
    var interfaceBB = '$4DTEXT(WEB_vt_interface)';
    var dataSet = <!--#4DHTML WEB_vt_dataListeImmos -->;
    var contenuColonnes = [
        { data: null, defaultContent: '' }, // colonne 0, class dtr-control pour responsive 
        { data: 'Code_affaire',
            render: function ( data, type, row ) {
                return '<a rel="modal:open" href="AJAX/get/Affaire/' + data + '?tcom1=$4DTEXT(WEB_vt_interface)&template=affaire/details/modal/immobilisation"><i class="fa-solid fa-magnifying-glass" title="Consulter la fiche"></i></a>';
            }
        },
        { data: {
            _: 'dateDebut',
            display: 'dateDebut.display',
            sort: 'dateDebut.sort'
            }
        },
        { data: 'Code_affaire'},
        { data: 'Libelle_affaire'},
        { data: 'numSerie.libelle' },
        { data: 'societe.libelle' },
        { data: 'personne',
            render: function ( data, type, row ) {
                if (data.Pers_Physique == false) {              
                    if (data.Societe == 'BHS Corrugated France') {
                        var utilisateur = 'BHS (' + data.CP_Avant.substring(0, 2) + ')' ;
                    } else {
                        var utilisateur = data.Societe;
                    }               
                } else {
                    var utilisateur = data.Prenom + " " + data.Nom;
                }
            return utilisateur;
            }
         },
        { data: 'autresPersonnes[0].personne.Societe'},
        { data: 'etat.libelle' },
        { data: 'Montant1' },
        { data: 'dateFin', render: render_controle_date },
        { data: 'Montant2' },
        { data: 'compteurFichiers',
            render: function ( data, type, row ) {
                if (data > 0) {
                    var icone = '<i class="fa-solid fa-circle fa-xs has-text-dark"></i> ';
                } else {
                    var icone = '';
                }
            return icone;
            }
        },
        { data: 'facture.libelle' },
        { data: 'localisation.libelle' },
        { data: 'commentaireFormate'},
        { data: 'dateDebut.annee'}
    ];
    
    $(document).ready(function() {
    //  $('#liste_immos').DataTable( {
        var table = new DataTable('#liste_immos', {
            data: dataSet,
            columns: contenuColonnes,
            fixedHeader: true,
            pageLength: -1,
            layout: {
                top2: 'searchPanes',
                top1: function () {
                    let legende = document.createElement('div');
                    legende.innerHTML = '<p class="has-text-centered has-text-grey mb-3">Cliquer sur la ligne ou sur le <span class="mx-1">&#9654;</span> pour afficher des informations complémentaires.</p>';
                    return legende;
                }
            },
            searchPanes: {
                columns: [17, 6, 7, 8, 9, 15],
                cascadePanes: true
            },
            columnDefs: [
                { orderable: false, targets: [0, 1, 13] },
                { render: DataTable.render.number(' ', ',', 2, '' , ''), targets : [10, 12] }, // decimal
                { className: 'icone', targets: [0, 1, 13] },
                { className: 'dtr-control', targets: [0] },
                { className: 'white-space-nowrap', targets: [3, 6, 7, 8, 9] },
                { className: 'has-text-right', targets: [10, 12] },
                { className: 'has-text-centered', targets: [11] },
                { responsivePriority: 1, targets: [0, 1, 2, 3, 10, 11, 12, 13] },
            ],
            orderFixed: [[17, 'desc']], // tri fixe pour la rupture (dateDebut.annee)
            order: [[2, 'desc']], // tri par défaut dans chaque group (dateDebut)
            responsive: {
                details: {
                    type: 'column',
                    target: 'tr',
                    renderer: function (api, rowIdx, columns) {
                        var data = $.map(columns, function (col, i) {
                            return col.hidden
                                ? '<p class="has-text-grey px-2 py-2"><span class="has-text-weight-semibold smallcaps">'+ col.title + ' : </span>' + col.data + '</p>'
                                : '';
                            }).join('') ;
                        return data ;
                    }
                }
            },
            rowGroup: {
                dataSrc: 'dateDebut.annee', // groupe pour rupture
                startClassName: 'rupture has-text-' + interfaceBB, 
                endClassName: 'soustotal has-text-' + interfaceBB, 
                startRender: function ( rows, group ) {
                    return 'IMMOBILISATIONS ' + group + '<span class="is-pulled-right">('+rows.count()+')</span>';
                },
                endRender: function (rows, group) {
                    
                    // compter les colonnes visibles ou non (responsive)
                    var resposniveVisiblity = $('#liste_immos').DataTable().columns().responsiveHidden().toArray();
                    var numVisible = resposniveVisiblity.filter(x => x === true).length;
                    var numInvisible = resposniveVisiblity.filter(x => x === false).length;
                    // May need to perfom a check to make sure there are at least 4 columns visible otherwise colspan will be a negative number
                    var valueColspan = numVisible - 4; // les 4 colonnes à la fin qui doivent toujours être présentes (cf responsive priority)
                    
                //  var InfosCols = ' col visibles : ' + numVisible + ' / invisibles : ' + numInvisible;
                //  console.log(InfosCols);
                //  console.log('colspan : ' + valueColspan);
                                
                    // sous-totaux par groupe
                    var subtotalAchat =
                        rows
                            .data()
                            .pluck('Montant1')
                            .reduce(function (a, b) {
                                return a + b * 1;
                            }, 0) ;
    
                    var subtotalCession =
                        rows
                            .data()
                            .pluck('Montant2')
                            .reduce(function (a, b) {
                                return a + b * 1;
                            }, 0) ;
                    
                    subtotalAchat = DataTable.render.number(' ', ',', 2, null, '').display(subtotalAchat);
                    subtotalCession = DataTable.render.number(' ', ',', 2, null, '').display(subtotalCession);
    
                    return $('<tr/>')
                    .append('<td colspan="' + valueColspan + '" class="has-text-right has-text-weight-semibold white-space-nowrap">TOTAL ' + group + ' (' + rows.count() + ')</td>')
                    .append('<td class="has-text-right has-text-weight-semibold white-space-nowrap">' + subtotalAchat + '</td>')
                    .append('<td></td>')
                    .append('<td class="has-text-right has-text-weight-semibold white-space-nowrap">' + subtotalCession + '</td>')
                    .append('<td></td>');
                }
            },
            footerCallback: function (row, data, start, end, display) {
                var api = this.api();
                var pageInfo = api.page.info();
            
                // totaux (après filtres éventuels)
                totalAchat = api
                    .column(10, { page: 'current' })
                    .data()
                    .reduce(function (a, b) {
                        return a + b * 1;
                    }, 0);
    
                totalCession = api
                    .column(12, { page: 'current' })
                    .data()
                    .reduce(function (a, b) {
                        return a + b * 1;
                    }, 0);
    
                // number formatter : DataTable.render.number(thousands, decimal, precision, prefix, postfix)
                totalAchat = DataTable.render.number(' ', ',', 2, null, '').display(totalAchat);
                totalCession = DataTable.render.number(' ', ',', 2, null, '').display(totalCession);
    
                var labelTotal = 'TOTAL IMMOBILISATIONS (' + pageInfo.recordsDisplay + ')';
    
                // update footer
                $(api.column(1).footer()).html(labelTotal);
                $(api.column(10).footer()).html(totalAchat);
                $(api.column(12).footer()).html(totalCession);
            }
    
        });
        
        // recalcule le tableau quand on redimensionne (permet de mettre à jour le colspan des sous-totaux / groupe)
        table.on('responsive-resize', function () {
          table.draw('page');
        });
    
    // end document ready
     });
    </script>
    
  • MelodyNelsonMelodyNelson Posts: 126Questions: 21Answers: 2

    I've tried the page in another browser, the DT is not as slow, that's the good news.

    The bad news is I still need to reload the page to have the appropriate colspan.

    In the source, everything is fine when the page is loaded the first time (colspan=10):

    After resizing the window, the colspan doesn't have the good value (18 instead of 8, like he kept the initial value + the new one).
    Also, the colspan is added to the adjacents td as you can see on this screenshot.

    If I reload the page (without resizing), the colspan will be only in the first td and have the good value (8).

  • kthorngrenkthorngren Posts: 20,381Questions: 26Answers: 4,781
    edited April 12

    Did you add in the debounce code?

    I believe responsive has a small debounce factor built in to keep the responsive-resize from firing too ofter. Also I believe the responsive-resize is async. Both of these combined may produce in correct timing of calculating the colspan. for example event 1 may fire calling draw() and start the rowGroup.EndRender function. Then event 2 may fire doing the same. If event 2 finishes before 1 then you might have an incorrect result.

    Using the debounce code in my example might help as it will wait the 1000 msec before calling draw(). Even if multiple responsive-resize events are fired during the 1000 draw() called only once. If the timer 1000(1 second) is to long you could try reducing it for a more fluid display.

    Kevin

  • MelodyNelsonMelodyNelson Posts: 126Questions: 21Answers: 2

    Hi Kevin,

    Sorry for the delay to answer.

    I've just tried the debouncer code and it works well, also it doesn't seams slow like the previous version.

    I will see if I need to adjust the timer.

    Thanks a lot for your help on this case

  • kthorngrenkthorngren Posts: 20,381Questions: 26Answers: 4,781

    Great, glad it helped!

    Kevin

  • MelodyNelsonMelodyNelson Posts: 126Questions: 21Answers: 2

    Always the best help !
    Thanks again

Sign In or Register to comment.