Is heat table formatting possible via DataTables?
Is heat table formatting possible via DataTables?
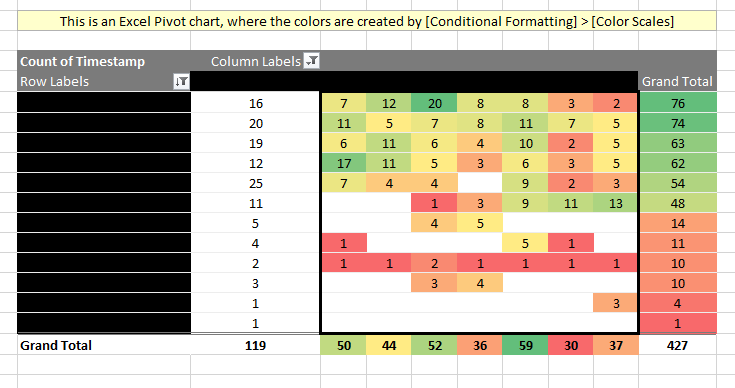
In Excel (I'm using Excel 2016) we have a Conditional Formatting option for Color Scales where you can select a range of numerical values and it "automagically" assigns a background and font color to each cell depending on its numerical value.
Here is an example of a real Excel table, with sensitive values redacted.

Now suppose that I created an equivalent in HTML. (Just imagine that I've created the equivalent table shown in the screenshot, but in HTML).
Are there any pre-existing DataTables components I can use to create and apply an equivalent type of color scale? Or maybe there's an existing jQuery library somewhere, but I don't know what the correct search term would be.
This question has accepted answers - jump to:
Answers
You can use
createdCell,columns.createdCellorrowCallbackto apply conditional formatting of the cells.Kevin
So that is how I can define a specific color to apply to a cell, but it looks like I need to define my own mechanism to determine the color to be applied.
Interesting, wasn't familiar with Excel heat maps until now. I did find a JS library that seems to work.
https://github.com/gryevns/jquery-colorize
Took their table example from examples.html and built this example using both DOM based data and JS data.
http://live.datatables.net/siqoreko/1/edit
HTH,
Kevin
Thanks @kthorngren. I'll have to play around with it tomorrow, but it appears to be a labor saver.
That is really properly smart Kevin. Nice one!