apply the column hide functionality for appended data

apply the column hide functionality for appended data

Khalid TeliKhalid Teli Posts: 251Questions: 71Answers: 0

Hi,

Case-1) I have a datatable which include the rowGroup functionality, the table looks like this .

http://live.datatables.net/babifane/1/edit

Case-2) when I hide the column 3 , it doesn't hide the .append data (<td>) used in rowGroup, as shown in the example below .

live.datatables.net/kemiyaxu/1/edit

If I hide the column 3 , how can I hide the.append(<td>) data used in rowGroup

Thank you

This question has an accepted answers - jump to answer

Answers

  • colincolin Posts: 15,112Questions: 1Answers: 2,583

    Your code needs to consider the visibility of the columns when creating that grouping row. You also need to issue a draw() when changing the visibility to ensure the grouping row is redrawn.

    This thread may help, as it's discussing this issue too.

    Colin

  • Khalid TeliKhalid Teli Posts: 251Questions: 71Answers: 0

    Hi @collin
    Thank you. This code in the thread works fine.
    Step-1 : I included column visibility in rowGroup and it works fine

    Your code needs to consider the visibility of the columns when creating that grouping row.
    return $('<tr/>')
    .addClass(addClass)

                         .append( '<td colspan="5">  '+group+' --- Total: '+sum+' </td>' )
                         .append( '<td colspan="2"></td>' )
                         .append( table.column(8).visible() ? '<td class="text-center">' + optOne + '</td>' : '' ) 
                         .append( table.column(9).visible() ? '<td class="text-center">' + optTwo + '</td>' : '' );
    

    step-2 )

    In my table I use the drawCallback functionto hide the columns where header names are empty using: (this is my requirement)

      "drawCallback": function () {
    
                var api = this.api();
    
                  tableforecast.columns().every( function () {
                                var columnHeader = api.columns().header();
                                  var columnHeader = $(this.header()).text();
    
                                 if (columnHeader == "") {
    
                                    this.visible(false);
                                }
    
                                 else  {
    
                                   this.visible( true );
    
                                 }
                            });
    
                   },
    

    For this case, the redraw function below cause an error

              $('#contracts').on( 'column-visibility.dt', function ( e, settings, column, state ) {
    
            table.draw(true);
        } );
    

    seems to cause an error :
    datatables.js:5751 Uncaught RangeError: Maximum call stack size exceeded

    step-3) I tried to remove thedrawCallbackfunction which I used to hide columns and it doesnt show any error.

    Does it mean I need to call the redraw function somewhere inside drawcallback?

    Please help

    Thank you

  • kthorngrenkthorngren Posts: 20,141Questions: 26Answers: 4,735

    The problem is you are setting column visibility (this.visible(false);) within drawCallback which is invoking the column-visibility event which is calling the api draw() API causing the drawCallback to run. Causing the infinite loop error you are getting.

    Try this code in initComplete to initially hide these columns.

    Kevin

  • Khalid TeliKhalid Teli Posts: 251Questions: 71Answers: 0

    @kthorngren
    Thank you. I got the problem but, in my case I guess I will have to use drawCallback function because of following reasons:

    1) Based on the dropdown selection my table header names change. So on each selected value in dropdown there has to be a new draw function to get new header values.

    2) Also, based on individual values in the dropdown list, some columns need to be hidden based on their values. example if column has all zero values it is hidden. I have to check this on each draw.

    For example , in the image-1 ,
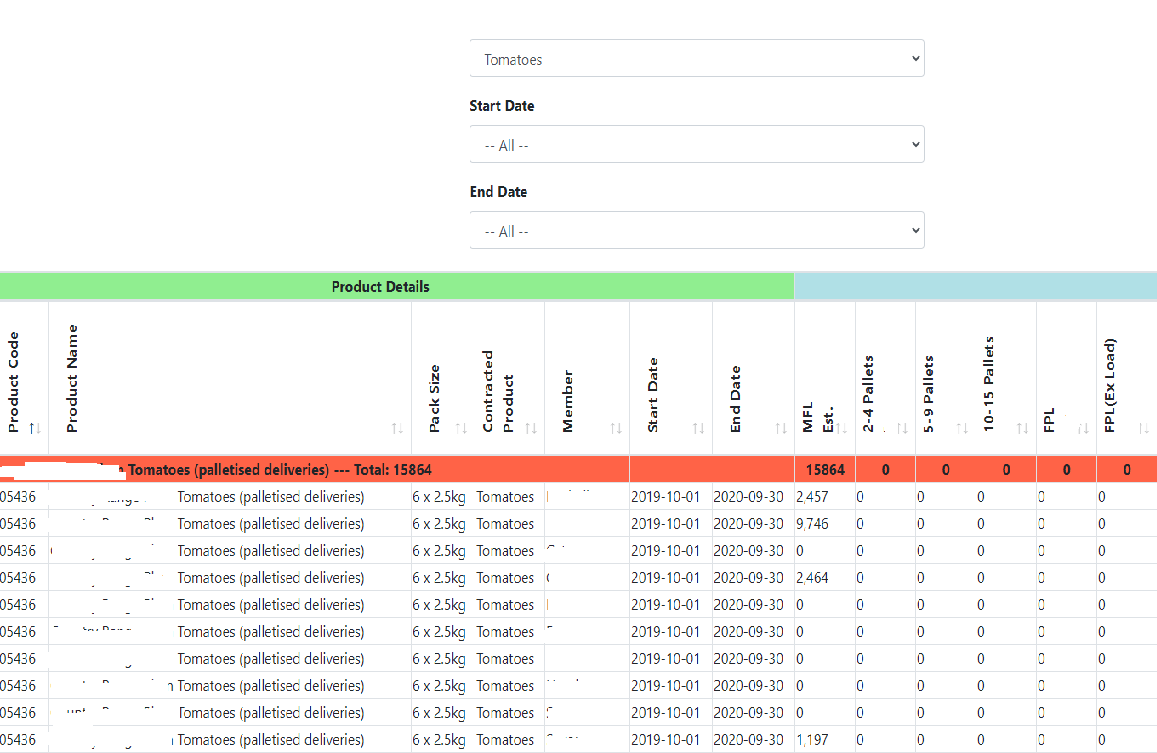
    if I select TOMATOES , table looks like this

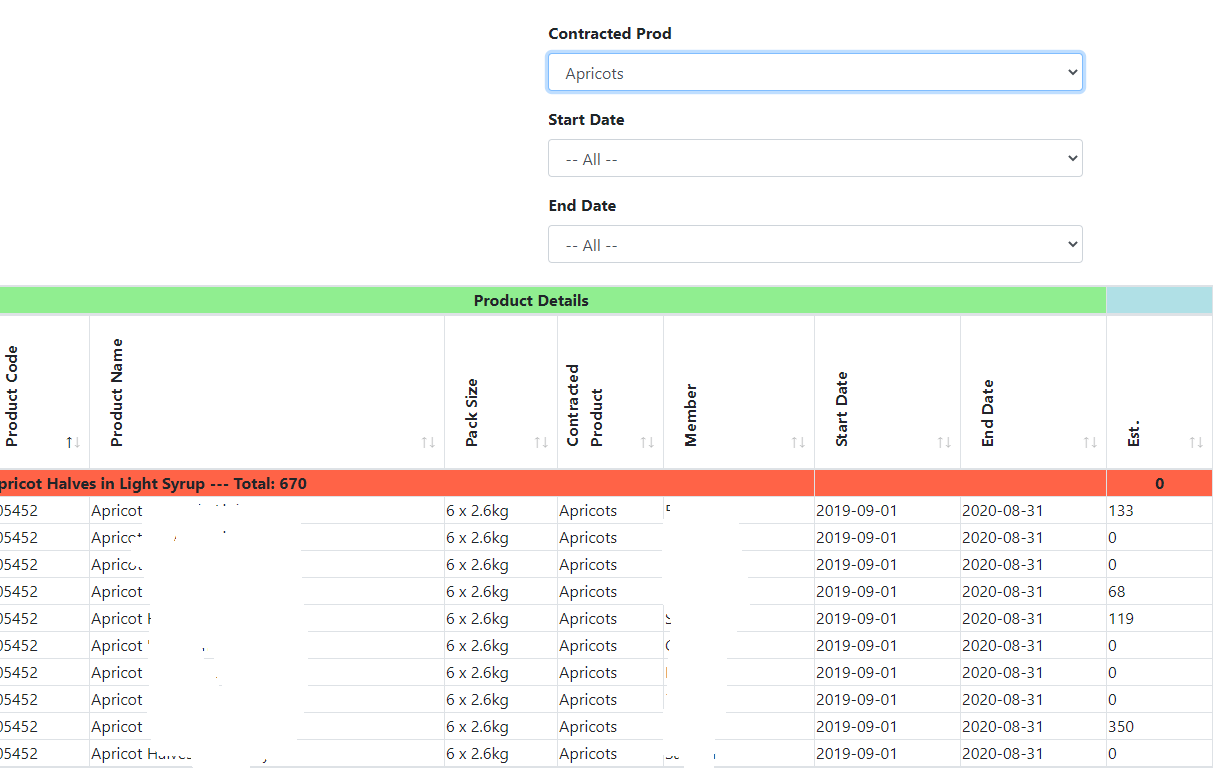
    and in image-2 if I select APRICOTS , table looks like this

    I hope it makes sense. is there any other way around?

    Thank you

  • colincolin Posts: 15,112Questions: 1Answers: 2,583

    You could use global flags to determine to run code in the callback - not pretty but they do the trick.

    Colin

  • Khalid TeliKhalid Teli Posts: 251Questions: 71Answers: 0

    Hi @colin
    Thank you. Can you please give me a very basic example or just an Idea how should I start/proceed with that?
    Thank you

  • kthorngrenkthorngren Posts: 20,141Questions: 26Answers: 4,735

    Here is one idea (pseudo code):

    var callDraw = False;
    
    ....
    
    drawCallback function () {
      callDraw = False;  // Don't call draw() after adjusting column visibility
      var api = this.api();
    ....
    },
    
    $('#contracts').on( 'column-visibility.dt', function ( e, settings, column, state ) {
       
        if (callDraw) {
          table.draw(true);
        }
        callDraw = True;  // Make sure to call draw if column visibility changes outside of drawCallback
    } );
    

    Another option might be to use turn the event off at the start of drawCallback then turn it back on at the end of drawCallback.

    Kevin

  • Khalid TeliKhalid Teli Posts: 251Questions: 71Answers: 0

    @kthorngren
    Thank you. I have been trying a lot but no luck.
    1) Every time when the column visibility changes and when the draw is called callDraw = True; it goes in loop again.
    2) as per my understanding when the drawback function is called and if callDraw is set to falseit shouldn't invoke the function again.

    .....
    ......
    
    var callDraw = false;
    
     var table = $('#contracts').DataTable( {
    
            "processing": true,
            "serverSide": true,
    
        "ajax":
    
         {
          url:"/xxxxx/contracts/fetch.php",
                type:'POST'
    
        },
                     rowGroup: {
    
                startRender: function ( rows, group ) {
              var tabletwo= $('#contracts').DataTable();
    
                  var intVal = function ( i ) {
                 return typeof i === 'string' ?
                     i.replace(/[\%£,]/g, '')*1 :
                     typeof i === 'number' ?
                         i : 0;
             };
    
                    var optOne = rows
                         .data()
                        .pluck('opt_one_firm')
                        .reduce( function (a, b) {
                            return a + b.replace(/[^\d]/g, '')*1;
                        }, 0) ;
                        ........
                        ......
                        .....
    
                        var sum = optOne + optTwo +optThree + optFour +optFive + optSix; 
                   addClass = 'colorCheck';
    
                    return $('<tr/>')
                                        .addClass(addClass)
    
                         .append( '<td colspan="5">  '+group+' --- Total: '+sum+' </td>' )
                         .append( '<td colspan="2"></td>' )
                         .append( table.column(8).visible() ? '<td class="text-center">' + optOne + '</td>' : '' ) 
                         .....


                },
                "dataSrc": ["product_name"]
            },


     "drawCallback": function ( settings ) {
      // console.log('precallback'+callDraw);
    
    
     callDraw = false;
    
    console.log('insidecallback'+callDraw);


                                            var api = this.api();
    
    
                                table.columns().every( function () {
                                var columnHeader = api.columns().header();
                                  var columnHeader = $(this.header()).text();


                                 if (columnHeader == "") {


                                    this.visible(false);
    
                                }
    
                                 else  {
    
                                   this.visible( true );
    
    }
    
                            });
    
    
                   },
    
    
        "columns": [
          { data: "product_id" },
          { data: "product_name" },
          .....
          .....  
          ],
    
      } );
    
    $('#contracts').on( 'column-visibility.dt', function ( e, settings, column, state ) {
    
          if (callDraw) {
    
        console.log('fxn'+ callDraw);
    
          table.draw(true);
    
        }
    
       callDraw = true; 
    
    } );
    
    
     });
    

    2)

    Another option might be to use turn the event off at the start of drawCallback then turn it back on at the end of drawCallback.

    tried turning it off using table.off( 'column-visibility.dt');and then again turned it on using table.on( 'column-visibility.dt'); but didnt work :(

    Thank you

  • kthorngrenkthorngren Posts: 20,141Questions: 26Answers: 4,735
    edited January 2021

    Best thing to do is to build a simple test case with drawCallback and the column-visibility event to see how to control the behavior. Then if you still need help we can look at the test case to help debug.
    https://datatables.net/manual/tech-notes/10#How-to-provide-a-test-case

    It is possible that my pseudo code isn't fully correct since its not tested :smile: It was meant to give you an idea of what to do.

    tried turning it off using table.off( 'column-visibility.dt');and then again turned it on using table.on( 'column-visibility.dt'); but didnt work :(

    Same with this. Not sure what you did but if you want to debug it please build a test case showing what you tried.

    Kevin

  • Khalid TeliKhalid Teli Posts: 251Questions: 71Answers: 0

    @kthorngren Thank you very much.

    I tried to create a test case but it seems to work here with out need to call for table draw() to recalc the RowGroup.

    If you look at the example in the link below live.datatables.net/wevobuzi/1/edit

    step-1) In the dropdown menu if you select : ** Ashton Cox ,** it hides the
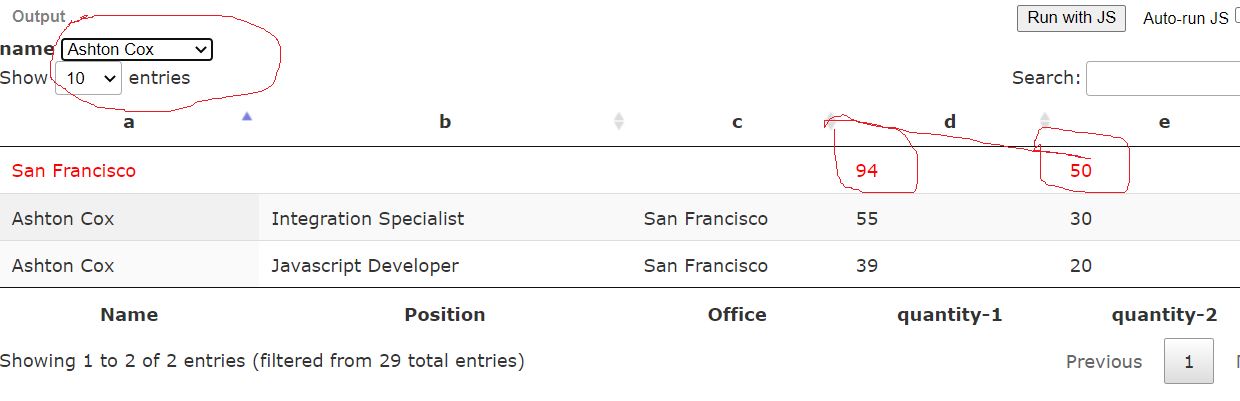
    column 'f' using the code inside drawCallback function. and calculates the RowGroup

    step-2) In the dropdown menu if you select : Angelica Ramos , it hides the
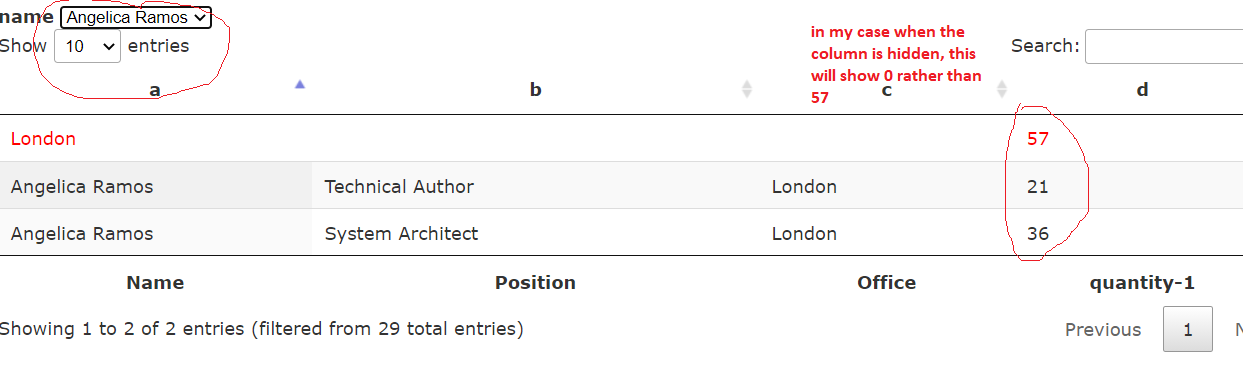
    column e and f, using the code inside drawCallback function and alculate steh rowGroup

    In my case when the column e is hidden the , the stats shown are wrong. instead of 57 it will show 0.

    Thank you

  • kthorngrenkthorngren Posts: 20,141Questions: 26Answers: 4,735

    In my case when the column e is hidden the , the stats shown are wrong. instead of 57 it will show 0.

    So you re saying the test case is working as expected but your page is not, correct? To help debug we will need to see the problem occur. There must be something else in your page, that is not in the test case, that is changing the behavior.

    Kevin

  • Khalid TeliKhalid Teli Posts: 251Questions: 71Answers: 0

    HI @kthorngren

    Thank you. Yes, that is right. It is not showing me any error rather than the rowgroup calculations are shows as 0, after columns are hidden.

    Here is my actual code and it is similar to one in example except serverside=true, just in case you can see something wrong here.

    However, I think I will have to debug my code step by step. Time consuming :(

        <table id="contracts" class="display table-bordered nowrap cell-border compact  mytables " cellspacing="0" style="width:100%">
    
              <tr>
                <th class="rotate"><div><span>Product Code</span></div></th>
                 <th class="rotate"><div><span>Product Name</span></div></th>
                 ....
    
                </tr>
                </thead>
    
                          </table>


        </body>
        </html>
    
        <script type="text/javascript">
    
    
        $(document).ready(function() {
    
    
          function headerChange() {
    
          var target = $('#col5_filter option:selected').val();
    
           if(target == "Chips"){
            $( tableprice.column(0).header() ).html('aa');
         $( tableprice.column(1).header() ).html('bb');
          $( tableprice.column(2).header() ).html('cc');
    
    
          }
          else if(target == "Tomatoes"){
          $( tableprice.column(0).header() ).html('a');
         $( tableprice.column(1).header() ).html('b');
          $( tableprice.column(2).header() ).html('c');
    
        .........
        }
        }
    
    
         var tablefirm = $('#contracts').DataTable( {
    
                "processing": true,
                "serverSide": true,
                 "paging":   true,
                 "scrollX":true,
    
                "info":   true,
            "dom": 'Bfrtlip',
            "lengthMenu": [[15, 30, 50, -1], [15, 30, 50, "All"]],
            "ajax":
    
             {
              url:"xxxxx/contracts_fetch.php",
                    type:'POST'
    
            },
                         rowGroup: {
    
                    startRender: function ( rows, group ) {
                  var table= $('#contracts_firm').DataTable();
    
                      var intVal = function ( i ) {
                     return typeof i === 'string' ?
                         i.replace(/[\%£,]/g, '')*1 :
                         typeof i === 'number' ?
                             i : 0;
                 };
    
                        var optOne = rows
                             .data()
                            .pluck('opt_one')
                            .reduce( function (a, b) {
                                return a + b.replace(/[^\d]/g, '')*1;
                            }, 0) ;
    
                      ......
                      .....
                       addClass = 'colorCheck';
    
                        return $('<tr/>')
                                            .addClass(addClass)
    
                             .append( '<td colspan="5">  '+group+' --- Total: '+sum+' </td>' )
                             .append( '<td colspan="2"></td>' )
                             .append( table.column(8).visible() ? '<td class="text-center">' + optOne + '</td>' : '' ) 
                             ....
                             ....
    
                             .append( '<td colspan="2"></td>' );


                    },
                    "dataSrc": ["product_name"]
                },
    
           "drawCallback": function ( settings ) {
    
    
             var tablefirm = $('#contracts_firm').DataTable();
                           var api = this.api();
    
            tablefirm.columns().every( function () {        
                   var columnHeader = api.columns().header();
                                      var columnHeader = $(this.header()).text();
    
                   if (columnHeader == "") {
    
                                        this.visible(false);
    
    
                                    }
    
                                     else  {
    
                                       this.visible( true );
    
        }     
    
    
               });
    
            },
    
    
            "columns": [
              { data: "product_id" },
              { data: "product_name" }
              ....
    
              ],
    
          } );
    
               $('#col5_filter').on( 'keyup change', function (){
                  headerChange();
                tablefirm
                .columns( 5 )
                .search( this.value )
                .draw();


        } );


         });
    
        </script>
    
  • kthorngrenkthorngren Posts: 20,141Questions: 26Answers: 4,735

    Here is my actual code and it is similar to one in example except serverside=true, just in case you can see something wrong here.

    The calculations will be based on the data in the client. With server side processing that is limited to the page being displayed. Guessing that might be the problem.

    Kevin

  • Khalid TeliKhalid Teli Posts: 251Questions: 71Answers: 0

    Hi @kthorngren
    thank you. I have been trying with different scenarios but didn't work. I created a more realistic test case for this issue.

    live.datatables.net/wixohopi/1/edit

    If you notice in the example, inside Column visibility event I have set callDraw to callDraw = false , the rowgroup calculations are not redrawn after columns are hidden.

    But as soon as you try to redraw the rowGroup calculations after column visibility changes by making callDraw = true the screen freezes , assuming it goes in a continuous loop.

     $('#example').on( 'column-visibility.dt', function ( e, settings, column, state ) {
    
                if (callDraw) {
                  table.draw(true);
                }
                callDraw = false;  // Make sure to call draw if column visibility changes outside of drawCallback
            } ); 
    

    Thank you

  • kthorngrenkthorngren Posts: 20,141Questions: 26Answers: 4,735
    Answer ✓

    Not sure why you have a settimeout function. I commented that out.

    You have

      
         "drawCallback": function () {
    
            calldraw = false;
    

    It should be callDraw. Fixed that.

    I removed the callDraw = false; // Make you have in the column-visibility and added callDraw = true; after the loop in the `-option drawCallback. Seems to work now.

    http://live.datatables.net/fosuxapa/1/edit

    Kevin

  • Khalid TeliKhalid Teli Posts: 251Questions: 71Answers: 0

    @kthorngren Thank you very much. You made my day :)

    Regards
    KT

This discussion has been closed.