Can I use DT for « double entry tables » ?

Can I use DT for « double entry tables » ?

MelodyNelsonMelodyNelson Posts: 208Questions: 31Answers: 2

Link to test case:
Debugger code (debug.datatables.net):
Error messages shown:
Description of problem:

Hi,

I must update some tables on a website and I'm wondering if I could create tables like that with DT ?

I have monthly data and I must group the infos by trimester and years (rowgroup could be helpful but I dont have all the construction in mind for now)

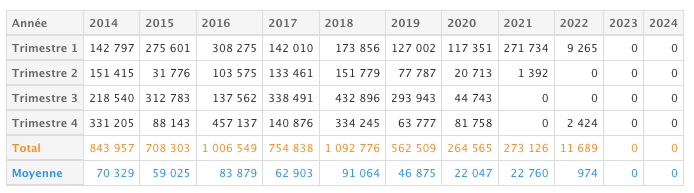
I didn't find examples width « double entries tables » so I don't know if it's a good choice to use DT for it or not.

Thanks

This question has accepted answers - jump to:

Answers

  • allanallan Posts: 63,075Questions: 1Answers: 10,385 Site admin
    Answer ✓

    Two rows in the table footer look like it would do it? Update the cells using a calculation on each draw similar to this one.

    Allan

  • MelodyNelsonMelodyNelson Posts: 208Questions: 31Answers: 2
    edited August 27

    Yes, it works. I already use the row group extension for the total lines and a callback for the footer.
    I think rowgroup could make all the row calculation, even the trimesters totals.
    But what I can't figure out with DT is something like column grouping.
    In this case, group by year because the data I receive is : a date and an amount.
    Ex : 21/1/2024, 1500
    18/1/2024, 2000, etc
    I should group the data first by year/column and then using row grouping for the trimesters and calculations. Maybe it's not a job for DT and should keep the classic tables and queries with this database,

  • kthorngrenkthorngren Posts: 21,117Questions: 26Answers: 4,916

    I'm not sure I understand exactly what you are asking for but maybe using rowGroup.dataSrc as a function will do what you want. See an example in the rowGroup.dataSrc comments section.

    Kevin

  • MelodyNelsonMelodyNelson Posts: 208Questions: 31Answers: 2

    I dont know how to explain clearly in english :\

    I'm gonna try by showing you the data the application is giving me : a numeric value for each month of each year.

    The data structure :

    [
        {
            "annee": 2014,
            "mois": 1,
            "reel": 60619
        },
        {
            "annee": 2014,
            "mois": 2,
            "reel": 23394
        },
        ...
        {
            "annee": 2023,
            "mois": 1,
            "reel": 0
        },
        {
            "annee": 2023,
            "mois": 2,
            "reel": 0
        }
    ]
    

    I was wondering how I can organize this kind of data in a DT with
    - grouping data by year in columns (that's the part I don't find ideas... yet ?)
    - grouping by trimester in rows (this one rowgroup can make it with a little work or if I can add the trimester value in the original data)

    I don't know if it helps to understand my original question.

    I don't want the code, just to know if it's a crazy idea or not because I don't need any special functions of DT except row grouping. The table must be minimalist but efficient :)

    My idea was to make only one request in the database to create the table you can see on the first post because today on the pages, there is a request for each cell of the HTML table.

    I'm trying to do recreate it « better » (optimization + « modern thinking »)

  • MelodyNelsonMelodyNelson Posts: 208Questions: 31Answers: 2

    EDIT : I found a way to add the trimester in the original data.

    Now the data structure is like that

    [
        {
            "annee": 2014,
            "mois": 1,
            "reel": 60619,
            "trimestre": 1
        },
        {
            "annee": 2014,
            "mois": 2,
            "reel": 23394,
            "trimestre": 1
        },
        {
            "annee": 2014,
            "mois": 3,
            "reel": 58784,
            "trimestre": 1
        },
        {
            "annee": 2014,
            "mois": 4,
            "reel": 66116,
            "trimestre": 2
        },
        {
            "annee": 2014,
            "mois": 5,
            "reel": 54658,
            "trimestre": 2
        },
        {
            "annee": 2014,
            "mois": 6,
            "reel": 30641,
            "trimestre": 2
        },
        {
            "annee": 2014,
            "mois": 7,
            "reel": 53493,
            "trimestre": 3
        },
        {
            "annee": 2014,
            "mois": 8,
            "reel": 13336,
            "trimestre": 3
        },
        {
            "annee": 2014,
            "mois": 9,
            "reel": 151711,
            "trimestre": 3
        },
        {
            "annee": 2014,
            "mois": 10,
            "reel": 30582,
            "trimestre": 4
        },
        {
            "annee": 2014,
            "mois": 11,
            "reel": 282560,
            "trimestre": 4
        },
        {
            "annee": 2014,
            "mois": 12,
            "reel": 18063,
            "trimestre": 4
        },
        {
            "annee": 2015,
            "mois": 1,
            "reel": 120372,
            "trimestre": 1
        },
        etc
    ]
    
  • kthorngrenkthorngren Posts: 21,117Questions: 26Answers: 4,916
    Answer ✓

    I think I understand the question now. I can only think of two options:

    1. Restructure the data so all columns are in one row. For example:
        {
            "trimestre": 1,
            "2014": {
                    "annee": 2014,
                    "mois": 1,
                    "reel": 60619
            },
            "2015": {
                    "annee": 2015,
                    "mois": 1,
                    "reel": 120372
            },
        },
    ....
    

    See the Nested Objects example for how to display this structure. The columns.data would look something like this:

        columns: [
            { data: 'trimestre' },
            { data: '2014.reel' },
            { data: '2015.reel' },
            .....
        ],
    
    1. The other option, which I'm not clear on exactly how to do this with your data, is to loop through the data set to see if a row exists in the Datatable that the object should be shown on. Use row() with row-selector as a function to find the matching row. Then use row().data() to fetch the current data, update the fetched data and update the row with row().data(). Here is a simple example that updates the Position for Ashton Cox.
      https://live.datatables.net/nosulaka/1/edit

    Kevin

  • MelodyNelsonMelodyNelson Posts: 208Questions: 31Answers: 2

    Thanks for your answer Kevin, I will have a better look tomorrow... my brain need a good night of sleep :smile:

    The problem with the data is that you could have empty years or trimesters (see the example bellow), so I need to create also the 0 values if I want to have the good values in the corresponding cells. I will try to find the better way to « collect and structure » the data.

  • kthorngrenkthorngren Posts: 21,117Questions: 26Answers: 4,916
    edited August 28

    The problem with the data is that you could have empty years or trimesters

    You can use columns.defaultContent to handle missing objects, for example:

    columns: [
        { data: 'trimestre' },
        { data: '2014.reel', defaultContent: '0' },
        { data: '2015.reel', defaultContent: '0' },
        .....
    ],
    

    Kevin

  • MelodyNelsonMelodyNelson Posts: 208Questions: 31Answers: 2

    Of course, that's why sleeping is important !
    Thanks Kevin

  • kthorngrenkthorngren Posts: 21,117Questions: 26Answers: 4,916

    that's why sleeping is important !

    Yes, that always helps to get a fresh perspective on whatever you are trying to solve :smile:

    Kevin

  • MelodyNelsonMelodyNelson Posts: 208Questions: 31Answers: 2

    I still didn't resolve how to work with monthly data

    I've created a fake dataset to try but with this structure, it doesn't work with the columns definitions you suggested

    columns: [
        { data: 'trimestre' },
        { data: '2014.reel', defaultContent: '0' },
        { data: '2015.reel', defaultContent: '0' },
        .....
    ],
    

    data structure :

    {
            "trimestre": 1,
            "2014":
                {
                    "annee": 2014,
                    "mois": 1,
                    "reel": 60619,
                    "trimestre": 1
                },
                {
                    "annee": 2014,
                    "mois": 2,
                    "reel": 23394,
                    "trimestre": 1
                },
                {
                    "annee": 2014,
                    "mois": 3,
                    "reel": 58784,
                    "trimestre": 1
                },
            "2015": 
                {
                    "annee": 2015,
                    "mois": 1,
                    "reel": 120372,
                    "trimestre": 1
                },
                {
                    "annee": 2015,
                    "mois": 2,
                    "reel": 82297,
                    "trimestre": 1
                },
                {
                    "annee": 2015,
                    "mois": 3,
                    "reel": 72932,
                    "trimestre": 1
                },          
            "2016": 
                ...
            "2017":
                ...
            etc
        },
        {
            "trimestre": 2,
            "2014": 
                {
                    "annee": 2014,
                    "mois": 4,
                    "reel": 66116,
                    "trimestre": 2
                },
                {
                    "annee": 2014,
                    "mois": 5,
                    "reel": 54658,
                    "trimestre": 2
                },
                {
                    "annee": 2014,
                    "mois": 6,
                    "reel": 30641,
                    "trimestre": 2
                },
                   etc
        },
    

    It's not a problem if I can see the monthly lines and hide them after.

    I think I'm gonna try to change again the data like that, show monthly rows and rowgrouping by trimester. With this approach I could add more fonctionnaly vs the old HTML table with a button to show/hide the monthly details.

    {
            "month": 1,
            "2014":
                {
                    "annee": 2014,
                    "mois": 1,
                    "reel": 60619,
                    "trimestre": 1
                }
            "2015": 
                {
                    "annee": 2015,
                    "mois": 1,
                    "reel": 120372,
                    "trimestre": 1
                }
            etc
        },
        {
            "month": 2,
            "2014": 
                {
                    "annee": 2014,
                    "mois": 2,
                    "reel": 23394,
                    "trimestre": 1
                },
            etc
        },
        etc
        {
            "month": 12,
                ...
        }
    
  • kthorngrenkthorngren Posts: 21,117Questions: 26Answers: 4,916

    I think you will need something more like the second snippet. Essentially each element in the data array needs to represent one row. Possibly you could include the trimestre value in each row to group on. Or use columns.render to calculate the trimestre value for grouping.

    Kevin

  • MelodyNelsonMelodyNelson Posts: 208Questions: 31Answers: 2

    Yes. The problem is to create the data structure like I want from the database, I don't have all the infos I need but the more I'm trying, the more I think it will works :)

  • MelodyNelsonMelodyNelson Posts: 208Questions: 31Answers: 2

    It's working but I have still some work to do around this table.

    For the total I'm using footerCallback.
    I've only put the totals for now.

    How can I target the second row (the blue one) in the footer to update it ?
    Should I put an ID to the row and use it for updating the right row ?

    // totals in the first row 
    $(api.column(1).footer()).html(Year10_total);
    $(api.column(2).footer()).html(Year9_total);
    $(api.column(3).footer()).html(Year8_total);
    $(api.column(4).footer()).html(Year7_total);
    $(api.column(5).footer()).html(Year6_total);
    $(api.column(6).footer()).html(Year5_total);
    $(api.column(7).footer()).html(Year4_total);
    $(api.column(8).footer()).html(Year3_total);
    $(api.column(9).footer()).html(Year2_total);
    $(api.column(10).footer()).html(Year1_total);
    $(api.column(11).footer()).html(CurrentYear_total);
    

    The footer :

    <tfoot>
            <tr>
                <th class="is-narrow has-background-light totalIndicateur has-text-weight-semibold">Total</th>
                <th class="is-narrow totalIndicateur has-text-weight-medium"></th>
                <th class="is-narrow totalIndicateur has-text-weight-medium"></th>
                <th class="is-narrow totalIndicateur has-text-weight-medium"></th>
                <th class="is-narrow totalIndicateur has-text-weight-medium"></th>
                <th class="is-narrow totalIndicateur has-text-weight-medium"></th>
                <th class="is-narrow totalIndicateur has-text-weight-medium"></th>
                <th class="is-narrow totalIndicateur has-text-weight-medium"></th>
                <th class="is-narrow totalIndicateur has-text-weight-medium"></th>
                <th class="is-narrow totalIndicateur has-text-weight-medium"></th>
                <th class="is-narrow totalIndicateur has-text-weight-medium"></th>
                <th class="is-narrow totalIndicateur has-text-weight-medium"></th>
            </tr>
            <tr>
                <th class="is-narrow has-background-light moyenneIndicateur has-text-weight-semibold">Moyenne</th>
                <th class="is-narrow moyenneIndicateur has-text-weight-normal"></th>
                <th class="is-narrow moyenneIndicateur has-text-weight-normal"></th>
                <th class="is-narrow moyenneIndicateur has-text-weight-normal"></th>
                <th class="is-narrow moyenneIndicateur has-text-weight-normal"></th>
                <th class="is-narrow moyenneIndicateur has-text-weight-normal"></th>
                <th class="is-narrow moyenneIndicateur has-text-weight-normal"></th>
                <th class="is-narrow moyenneIndicateur has-text-weight-normal"></th>
                <th class="is-narrow moyenneIndicateur has-text-weight-normal"></th>
                <th class="is-narrow moyenneIndicateur has-text-weight-normal"></th>
                <th class="is-narrow moyenneIndicateur has-text-weight-normal"></th>
                <th class="is-narrow moyenneIndicateur has-text-weight-normal"></th>
            </tr>
        </tfoot>
    
  • allanallan Posts: 63,075Questions: 1Answers: 10,385 Site admin
    Answer ✓

    Per the column().footer() documentation you can optionally pass in a number to the function to indicate what row in the footer you want. E.g.:

    api.column(1).footer(1)
    

    Alllan

  • MelodyNelsonMelodyNelson Posts: 208Questions: 31Answers: 2

    Thank you Allan.

  • MelodyNelsonMelodyNelson Posts: 208Questions: 31Answers: 2

    Thanks again Kevin and Allan. With your help, I could rewrite and old HTML table and replace 55 requests in a database by only one.

    I still have some comestic to do, add more « gadgets » and optimize the code if I can (I think about the subtotals and totals that are very repetitive, I dont know if I can create some loop, I will sleep on that for tonight).

    Here's the result for now (it's better with live data but I can't show it here).
    The users will like the toogle function on the trimesters (simple but helpfull)
    https://live.datatables.net/xomujosa/3/edit

Sign In or Register to comment.